
Bazaarvoice Pixel Health
As the UX designer, I led discovery research, designed workflows, planned usability sessions, and delivered a solution to a problem quietly plaguing internal and external customers for years.
The problem
Bazaarvoice needed to help their clients realize the return-on-investment (ROI) the service provides, as well as provide the correct data to ensure their systems send the correct post-interaction emails (PIE) to shoppers in a timely manner after a purchase. These PIEs ask the shopper to leave a review on the items they've purchased recently. You've likely seen them. In order to deliver these emails (and generate reports about how the consumer-generated content (CGC) helped lift transactions), clients are asked to include a snippet of code at the end of their shopping pipeline. This is generally called a "pixel," and it helps BV send a personalized invitation to the shopper to review the correct product.
Unfortunately, this code is pretty rigid, and with a lack of visibility into the client's e-commerce platform, the implementation can break easily. Bazaarvoice technical support and services partners asked for better tools to troubleshoot these problems, and the Product team knew we needed to surface problems with clients' technical health in the client tools Portal. Because the problem wasn't shiny, the task was given to a first time product manager. And me.
Involved people
- User Experience Designer
- Product Manager
- Technical Writer
- User Research team
- Engineering team
Discovery
The product manager was eager to solve the problem, and with a technical background, had been digging into the technical details around how the tool actually worked. After a few meetings, we started to understand how complex the system was, but we weren't clear how the a solution proposed by a previous PM, a a dashboard with a "Pixel Health Score," would solve the problem. We believed that more than just a score, the user needed to see what was wrong and be given an action to fix it.
Instead of tinkering with variations on that concept, I encouraged the PM to join me in some discovery research to better understand the problem we wanted to solve. We set up journey mapping sessions with the technical account managers (TAMs) and technical support consultants (TCs) that dealt with supporting the implementation and successful upkeep of clients' Pixels. These were the people who lived with the problem every day; we wouldn't find a better source on how the system worked and the key pain-points. After a few sessions with the participants, we began to see the path taken during initial setup and ongoing support, and the key touchpoints where things fell apart. There were far too many places where the system could fail silently, and clients relied entirely on a mixture of luck and highly engaged TAMs to even realize their Pixel implementation was broken.
To better understand how clients viewed these interactions, we engaged our user research team to expand this discovery research with users from clients with Pixel implementations. With their help, we realized clients were ultimately the only people who could fix their problems, but the TAMs and TCs were the only source of information on what was specifically breaking, and ultimately were the only people who could test if a solution had fixed the issue.
Both internal customers (like TAMs and TCs) and external clients needed to know when, how, and why an implementation broke, and the clients needed to know how to fix the issue, and have a tool to check if they had indeed fixed it.
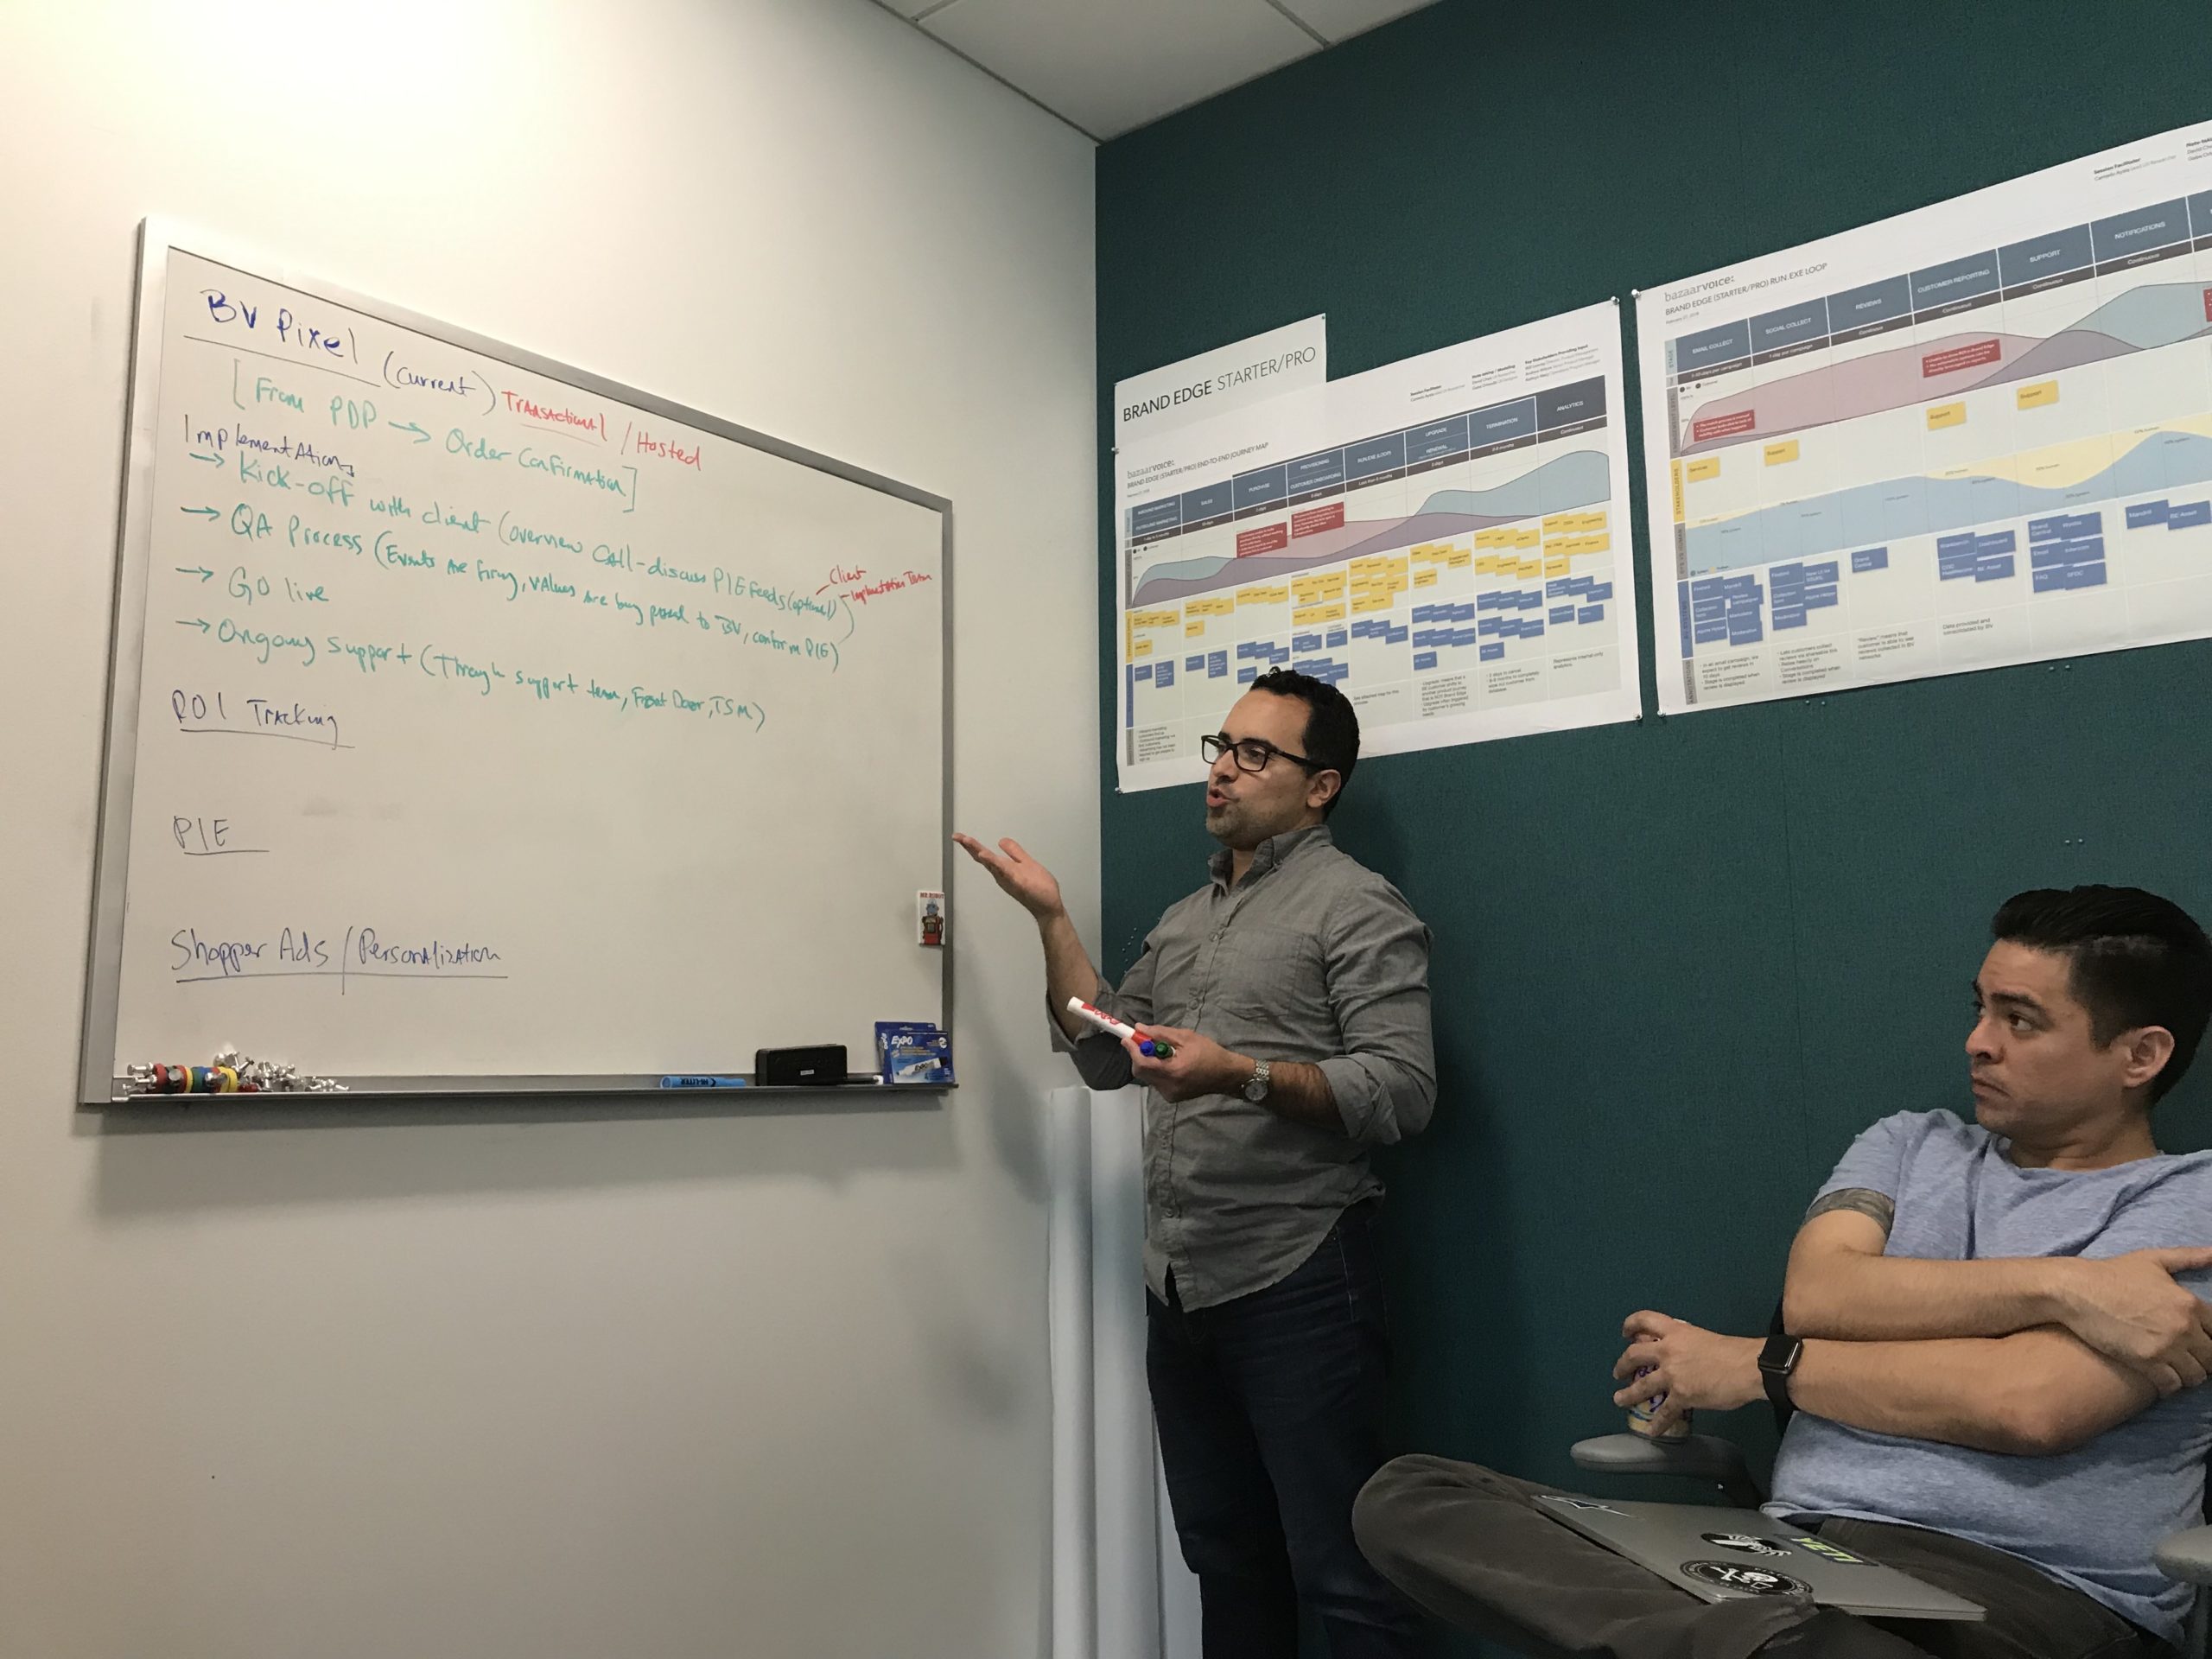
User researcher asks a technical consultant about painpoints during Pixel implemenation, as part of our Journey Mapping sessions.
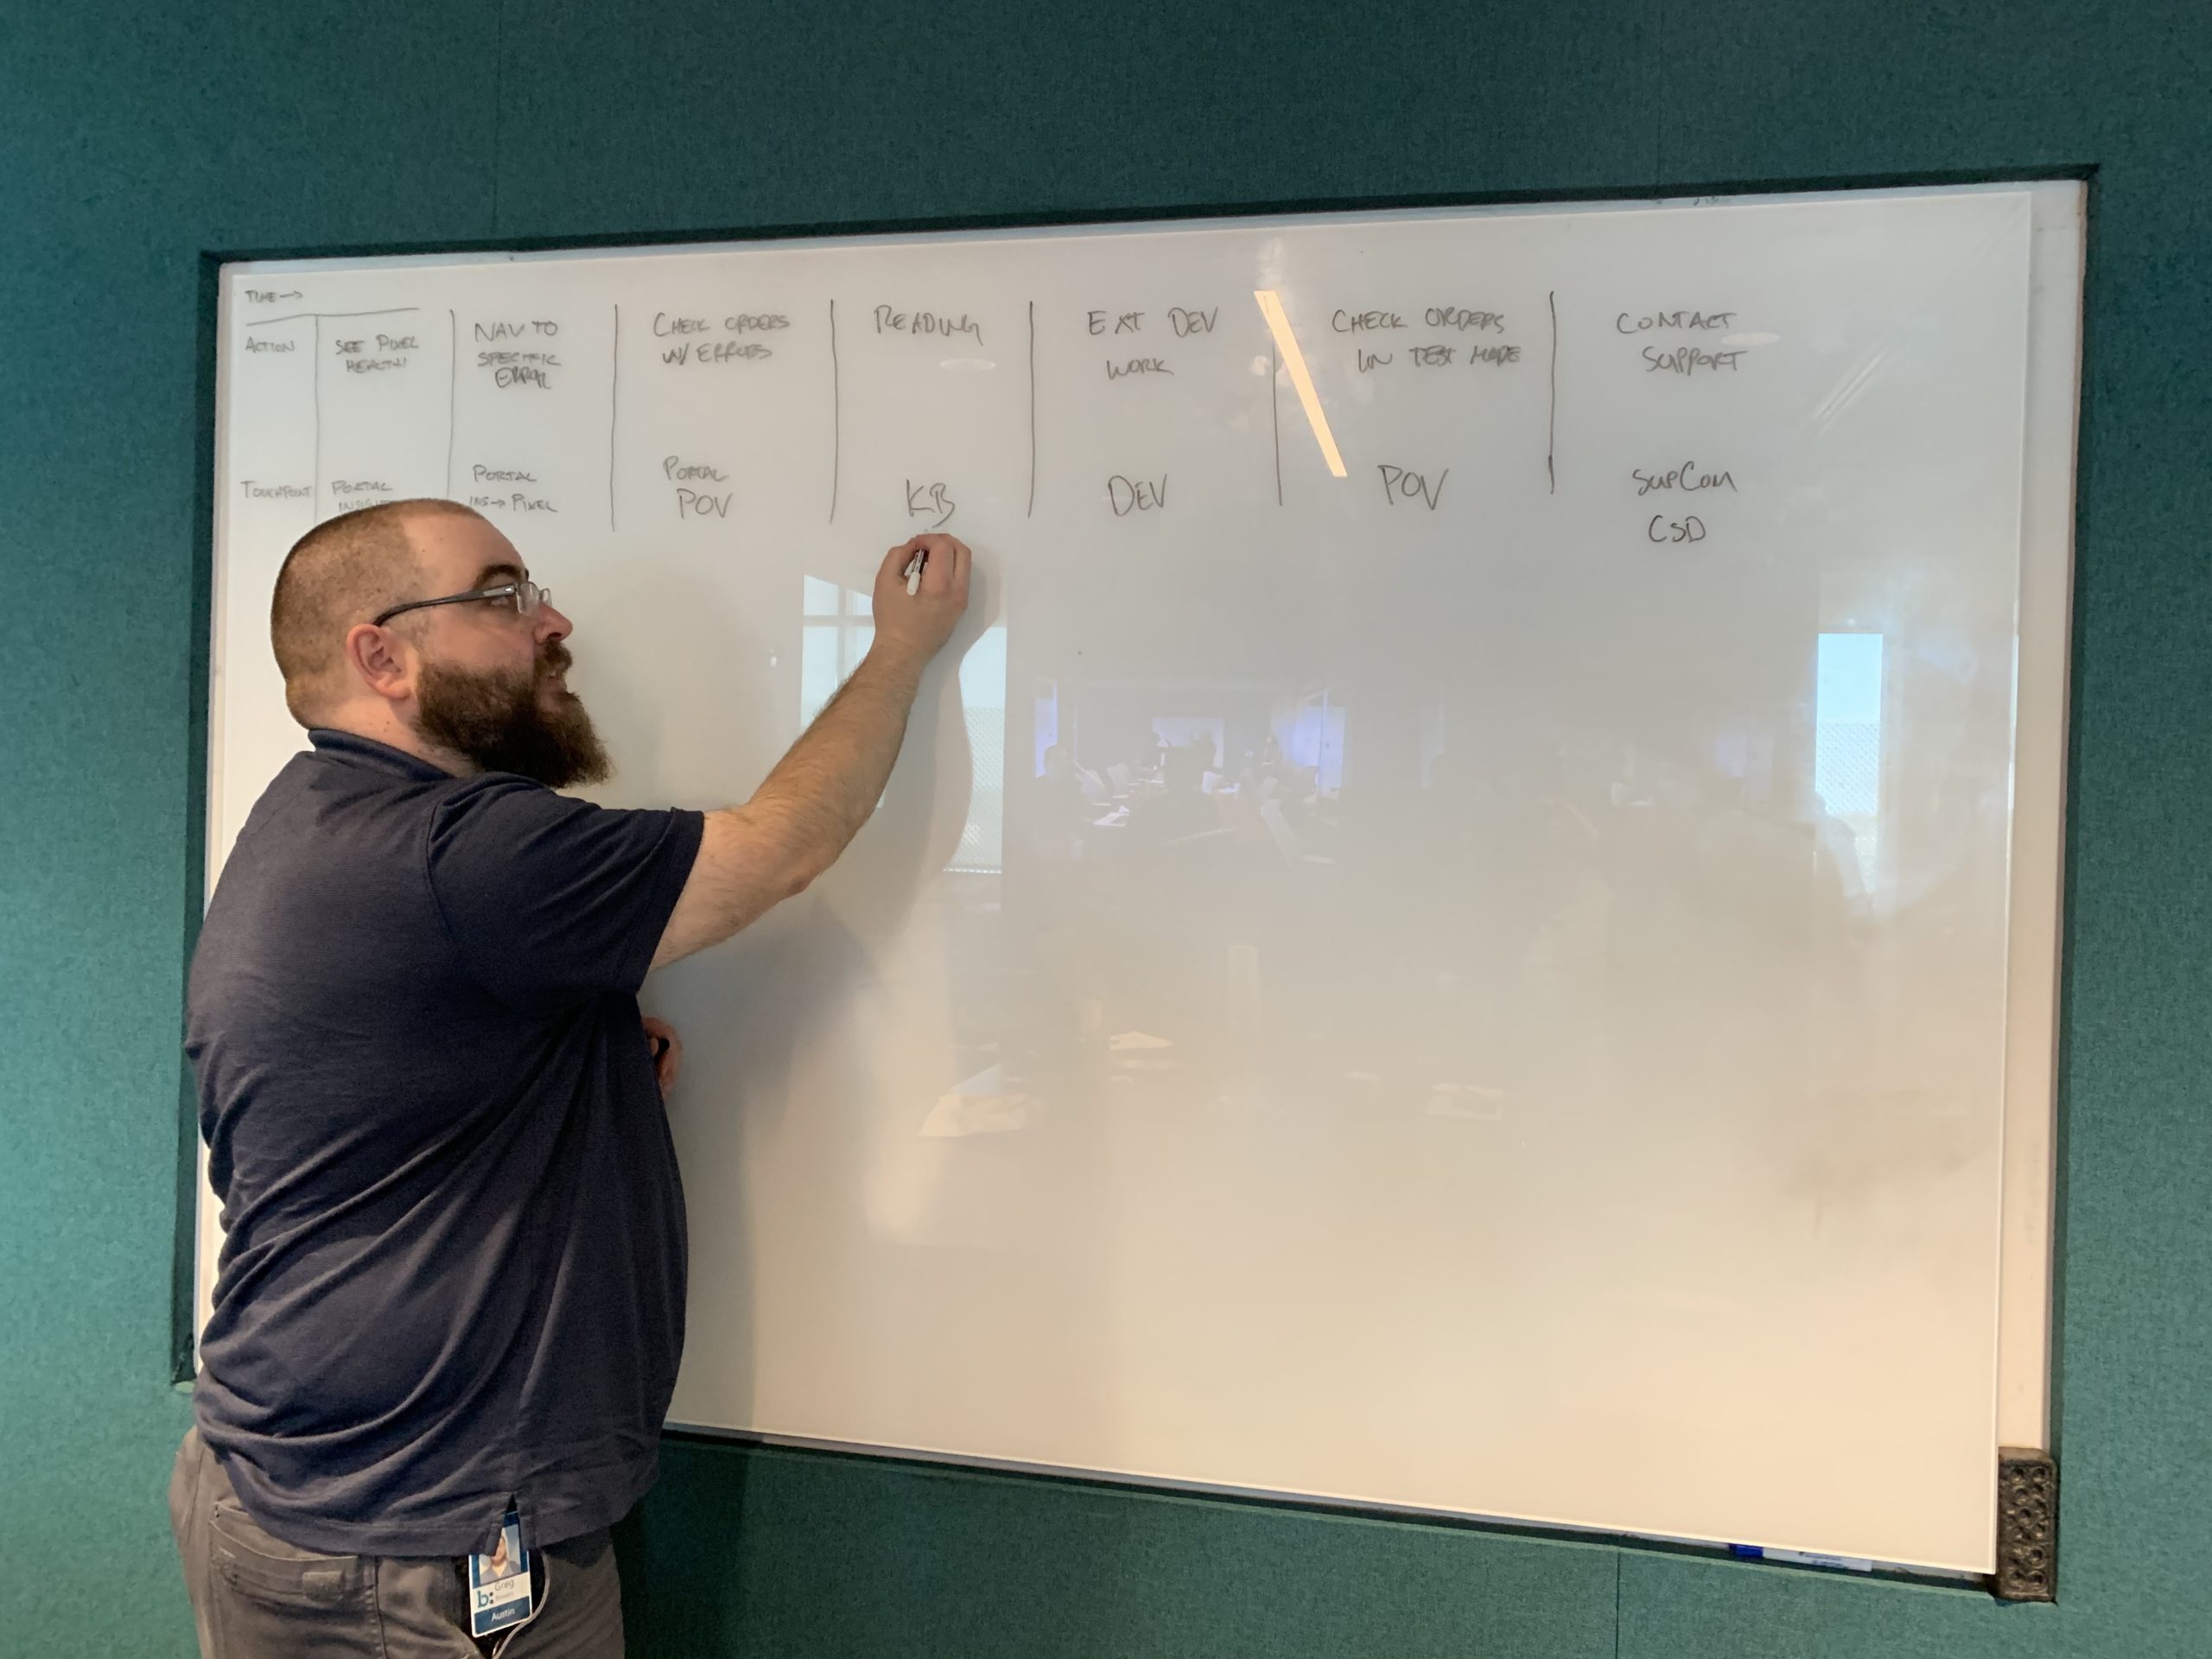
Greg leads a service design session to augment the journey mapping with a current state blueprint.
Design and User Testing
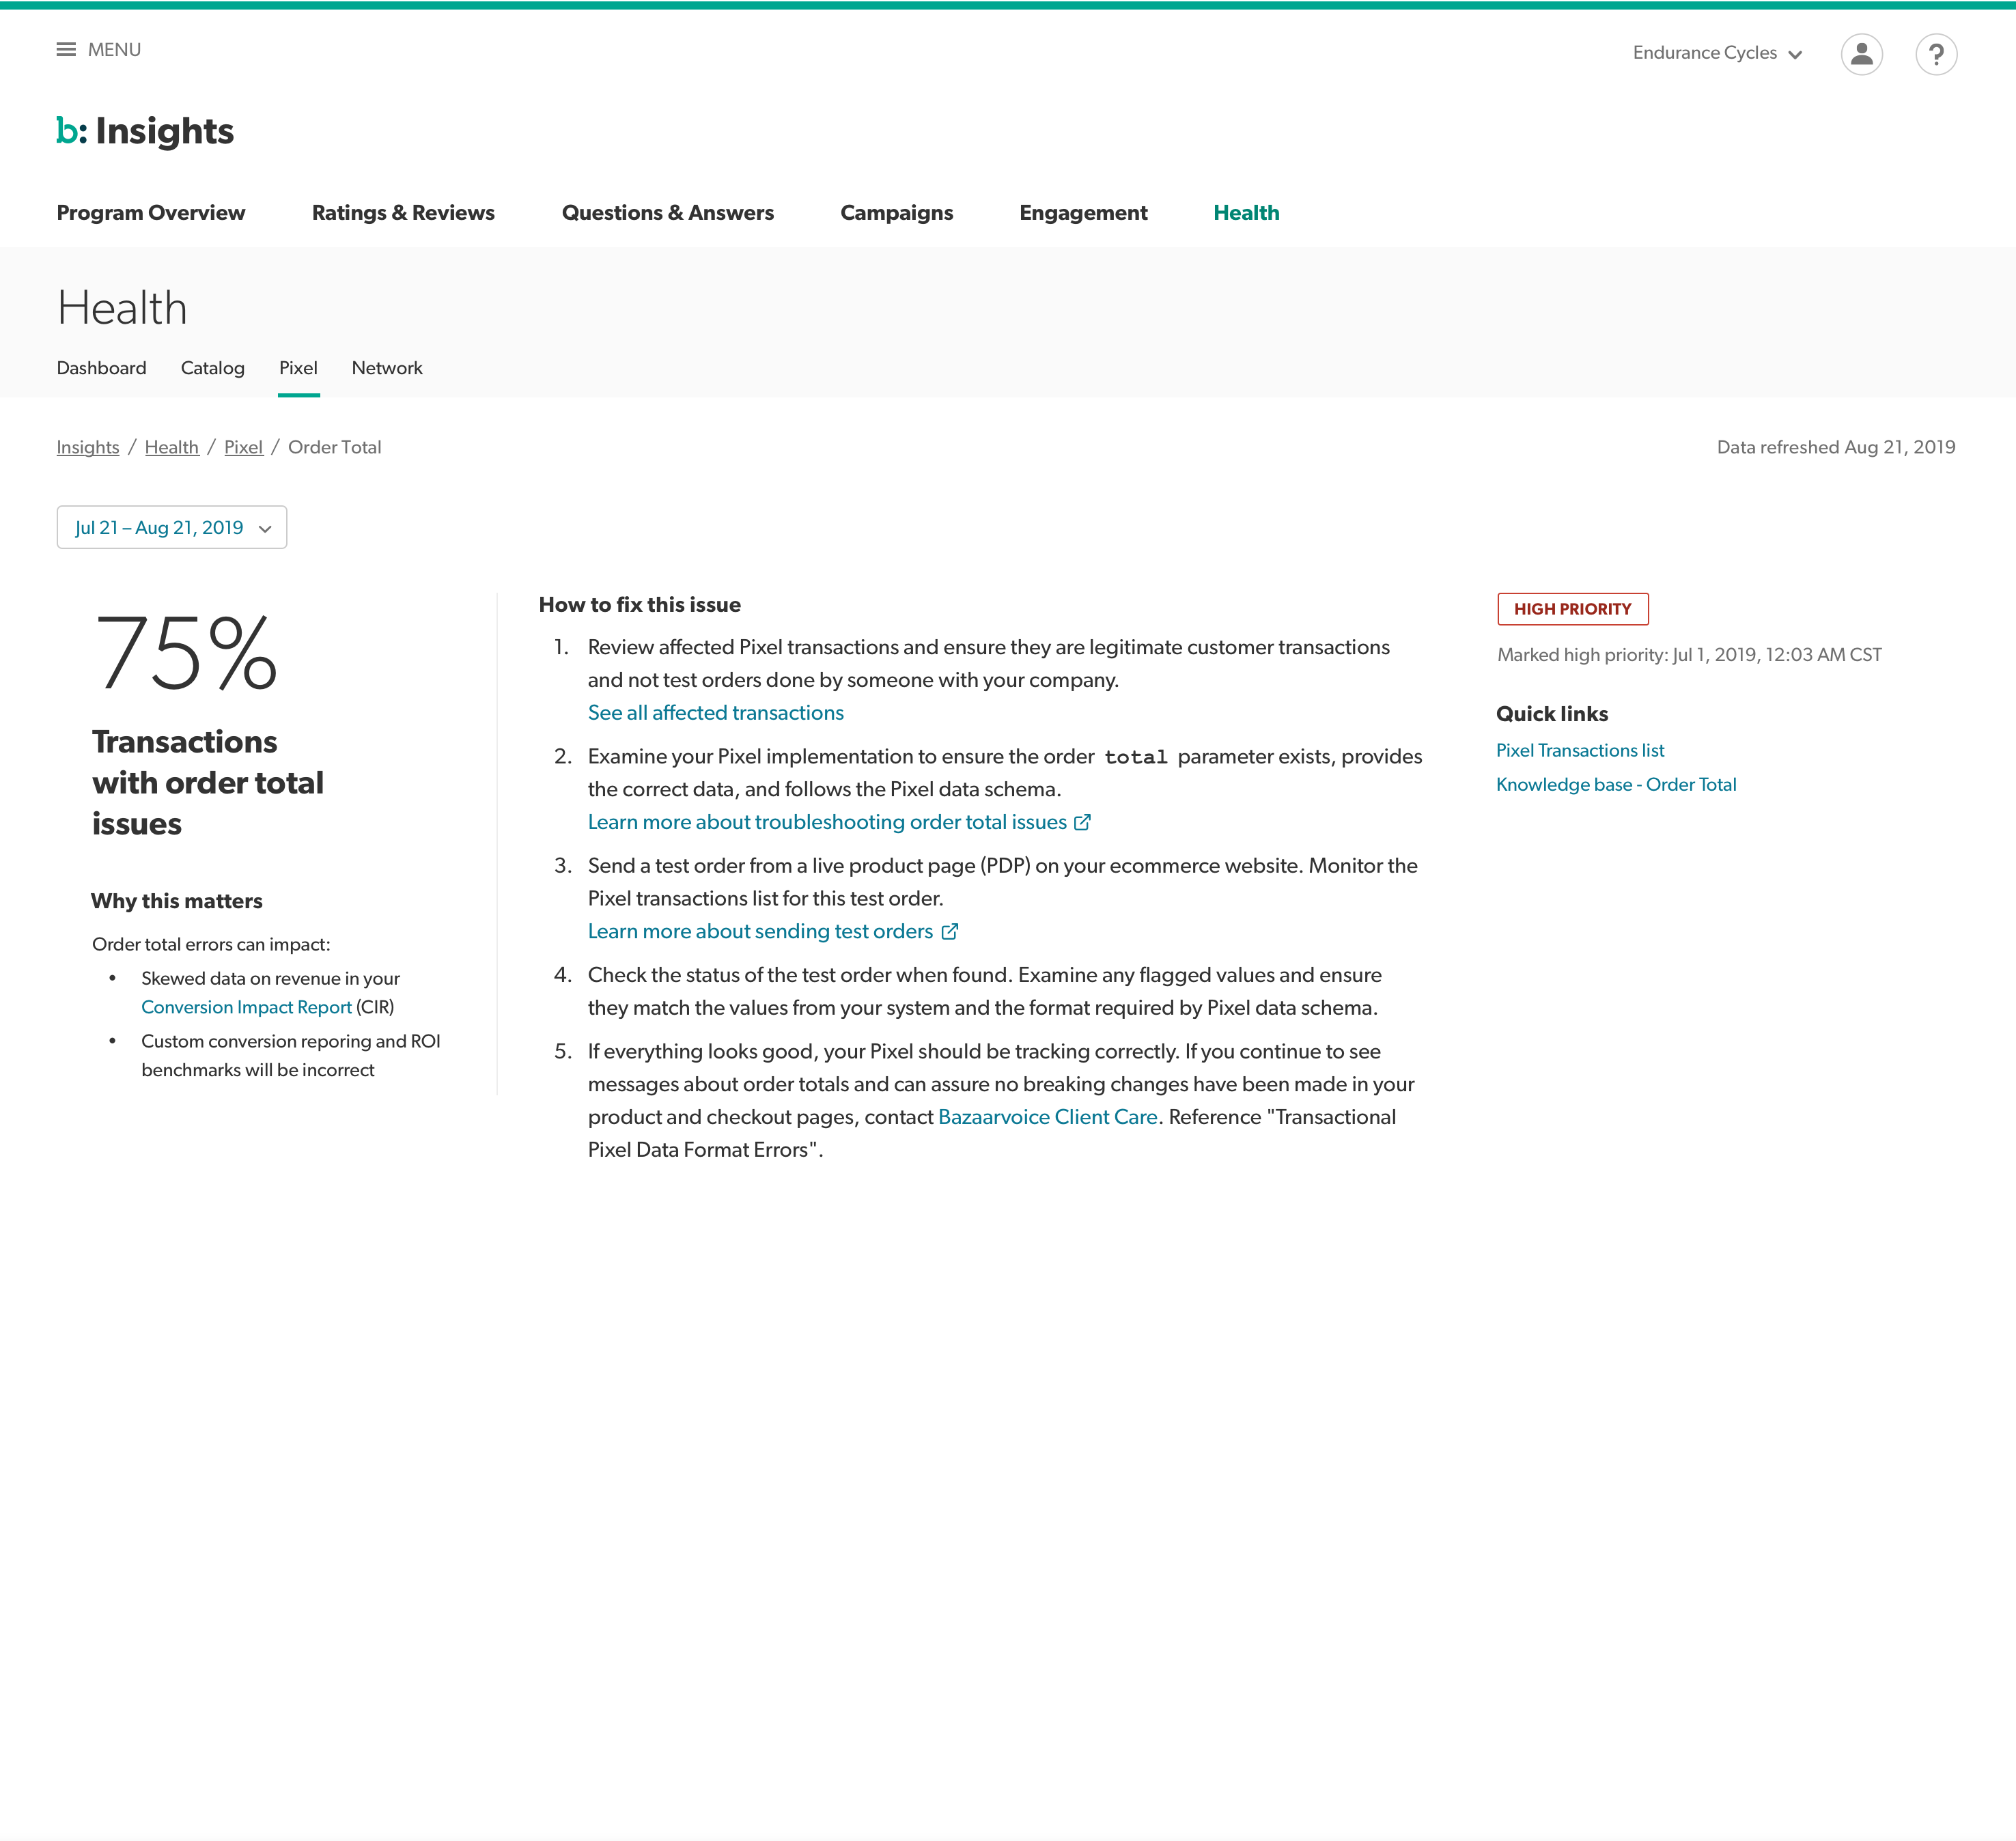
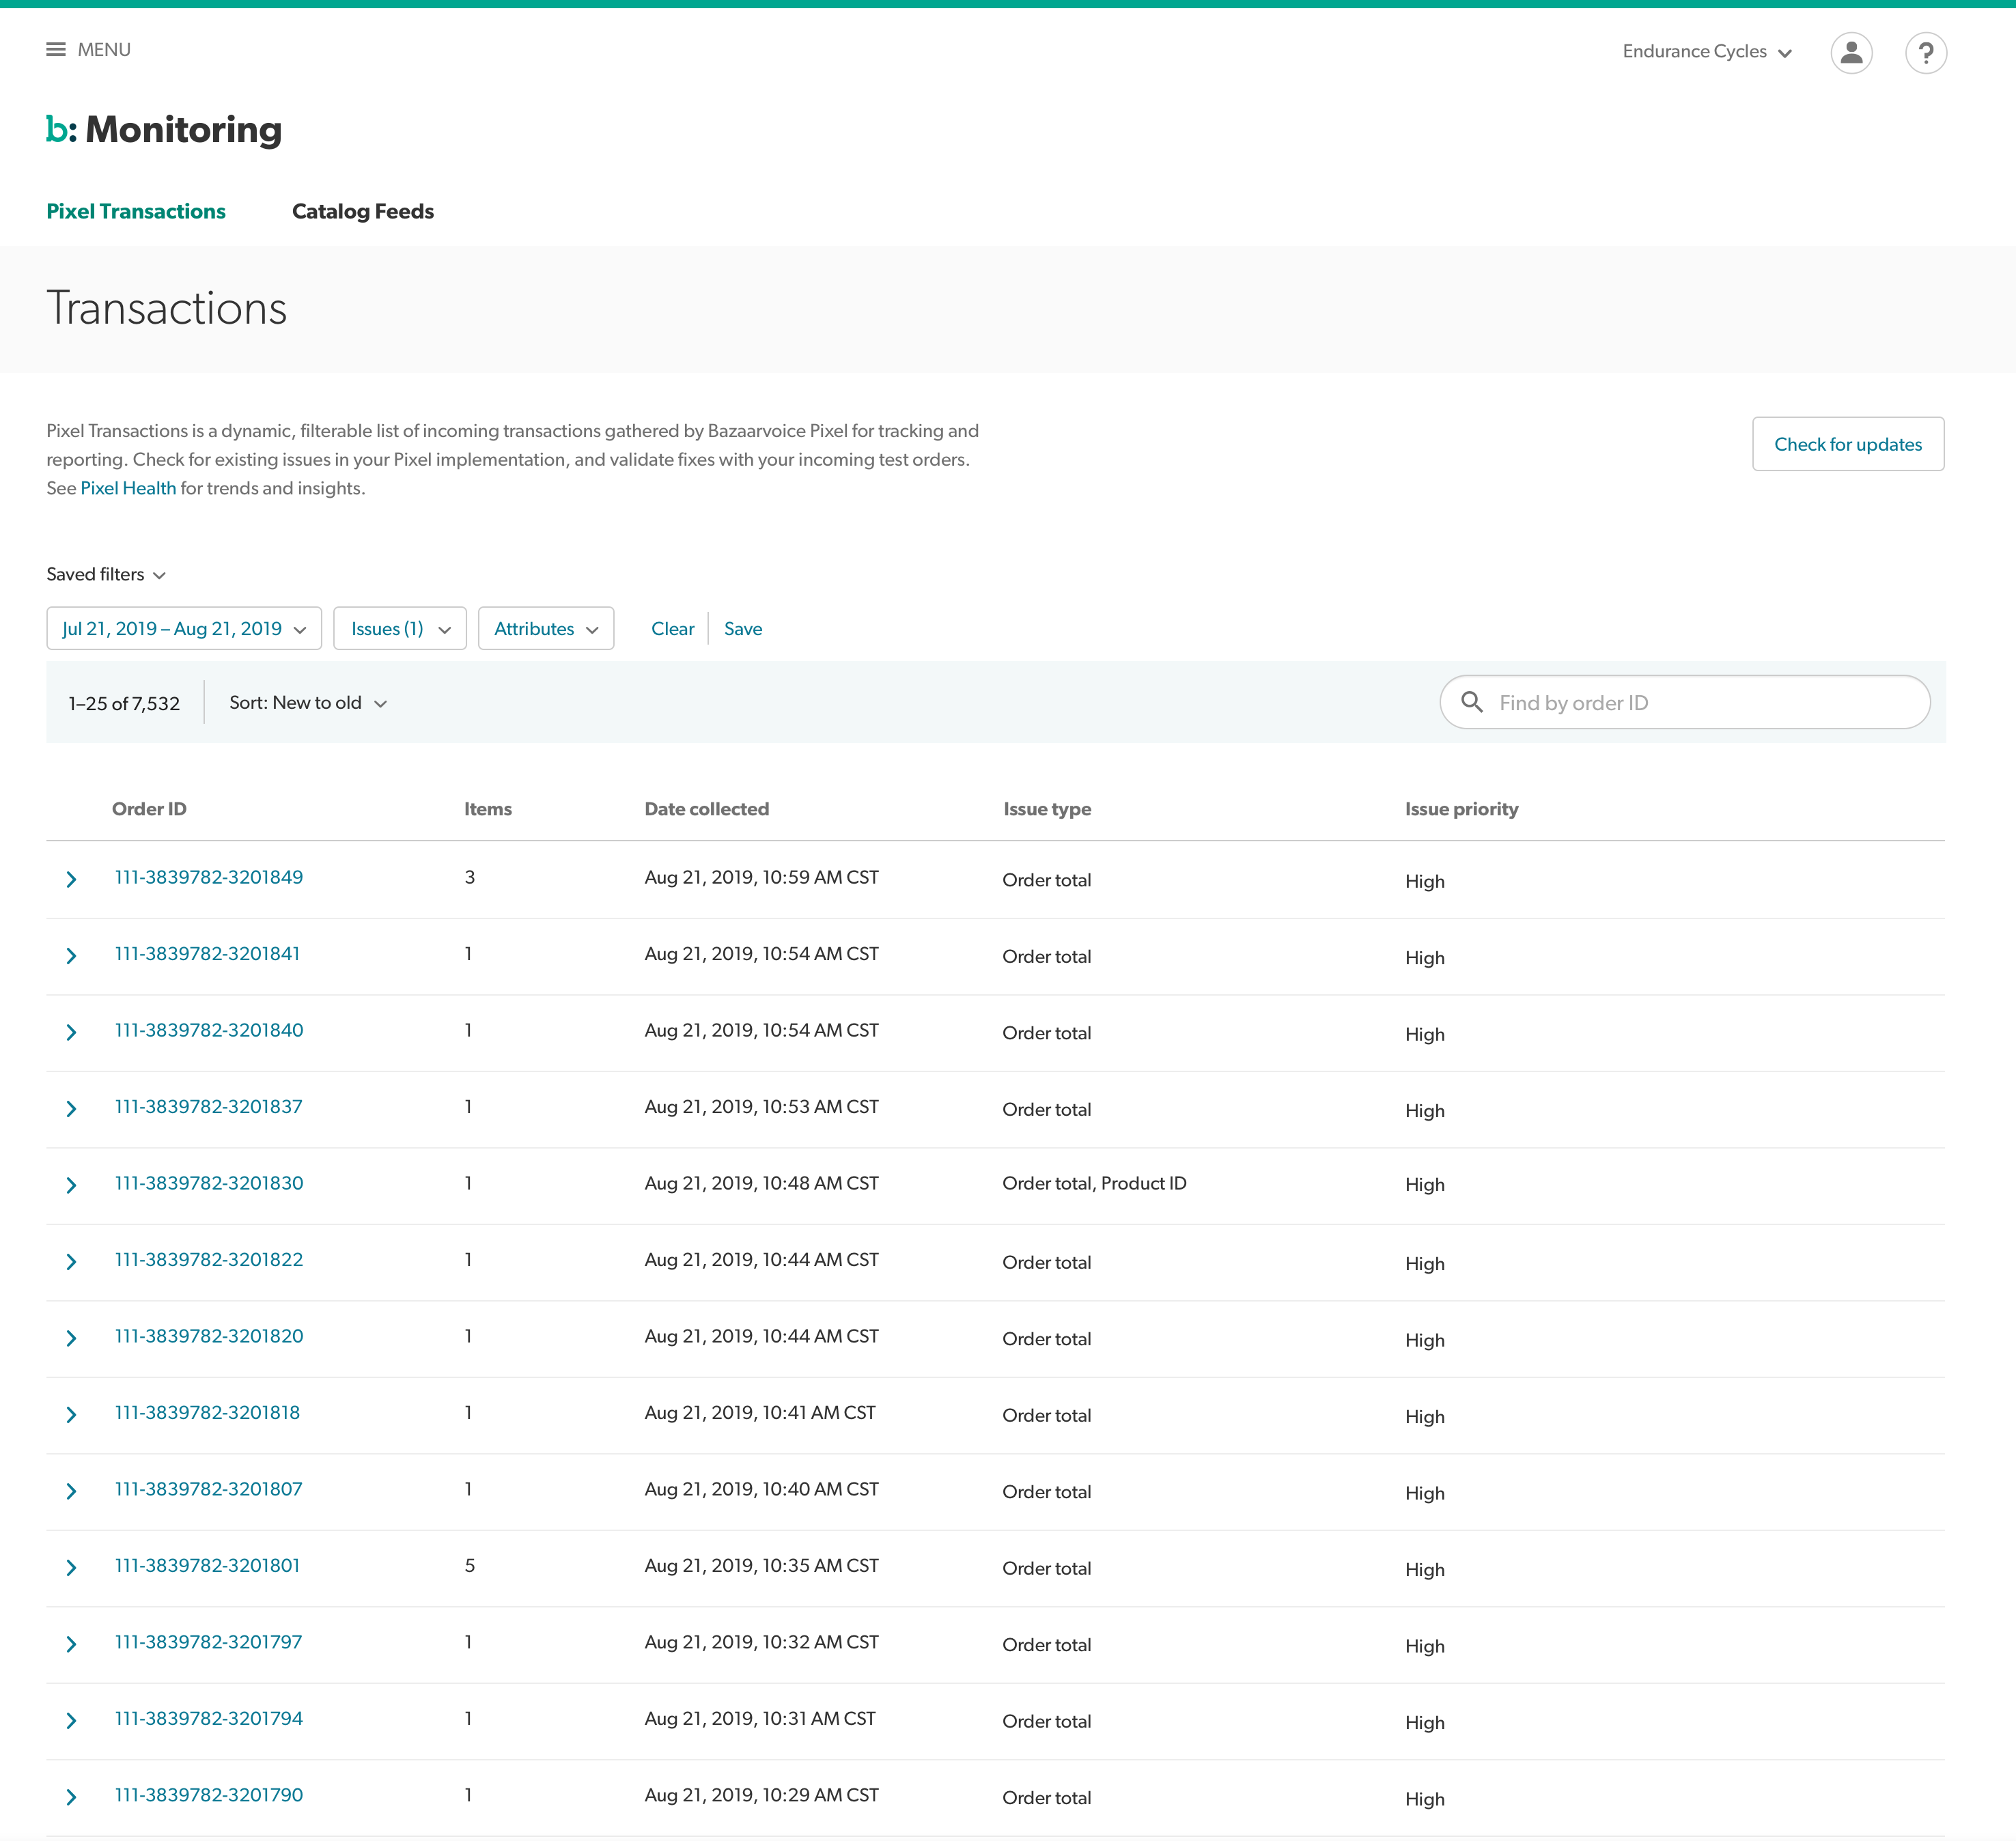
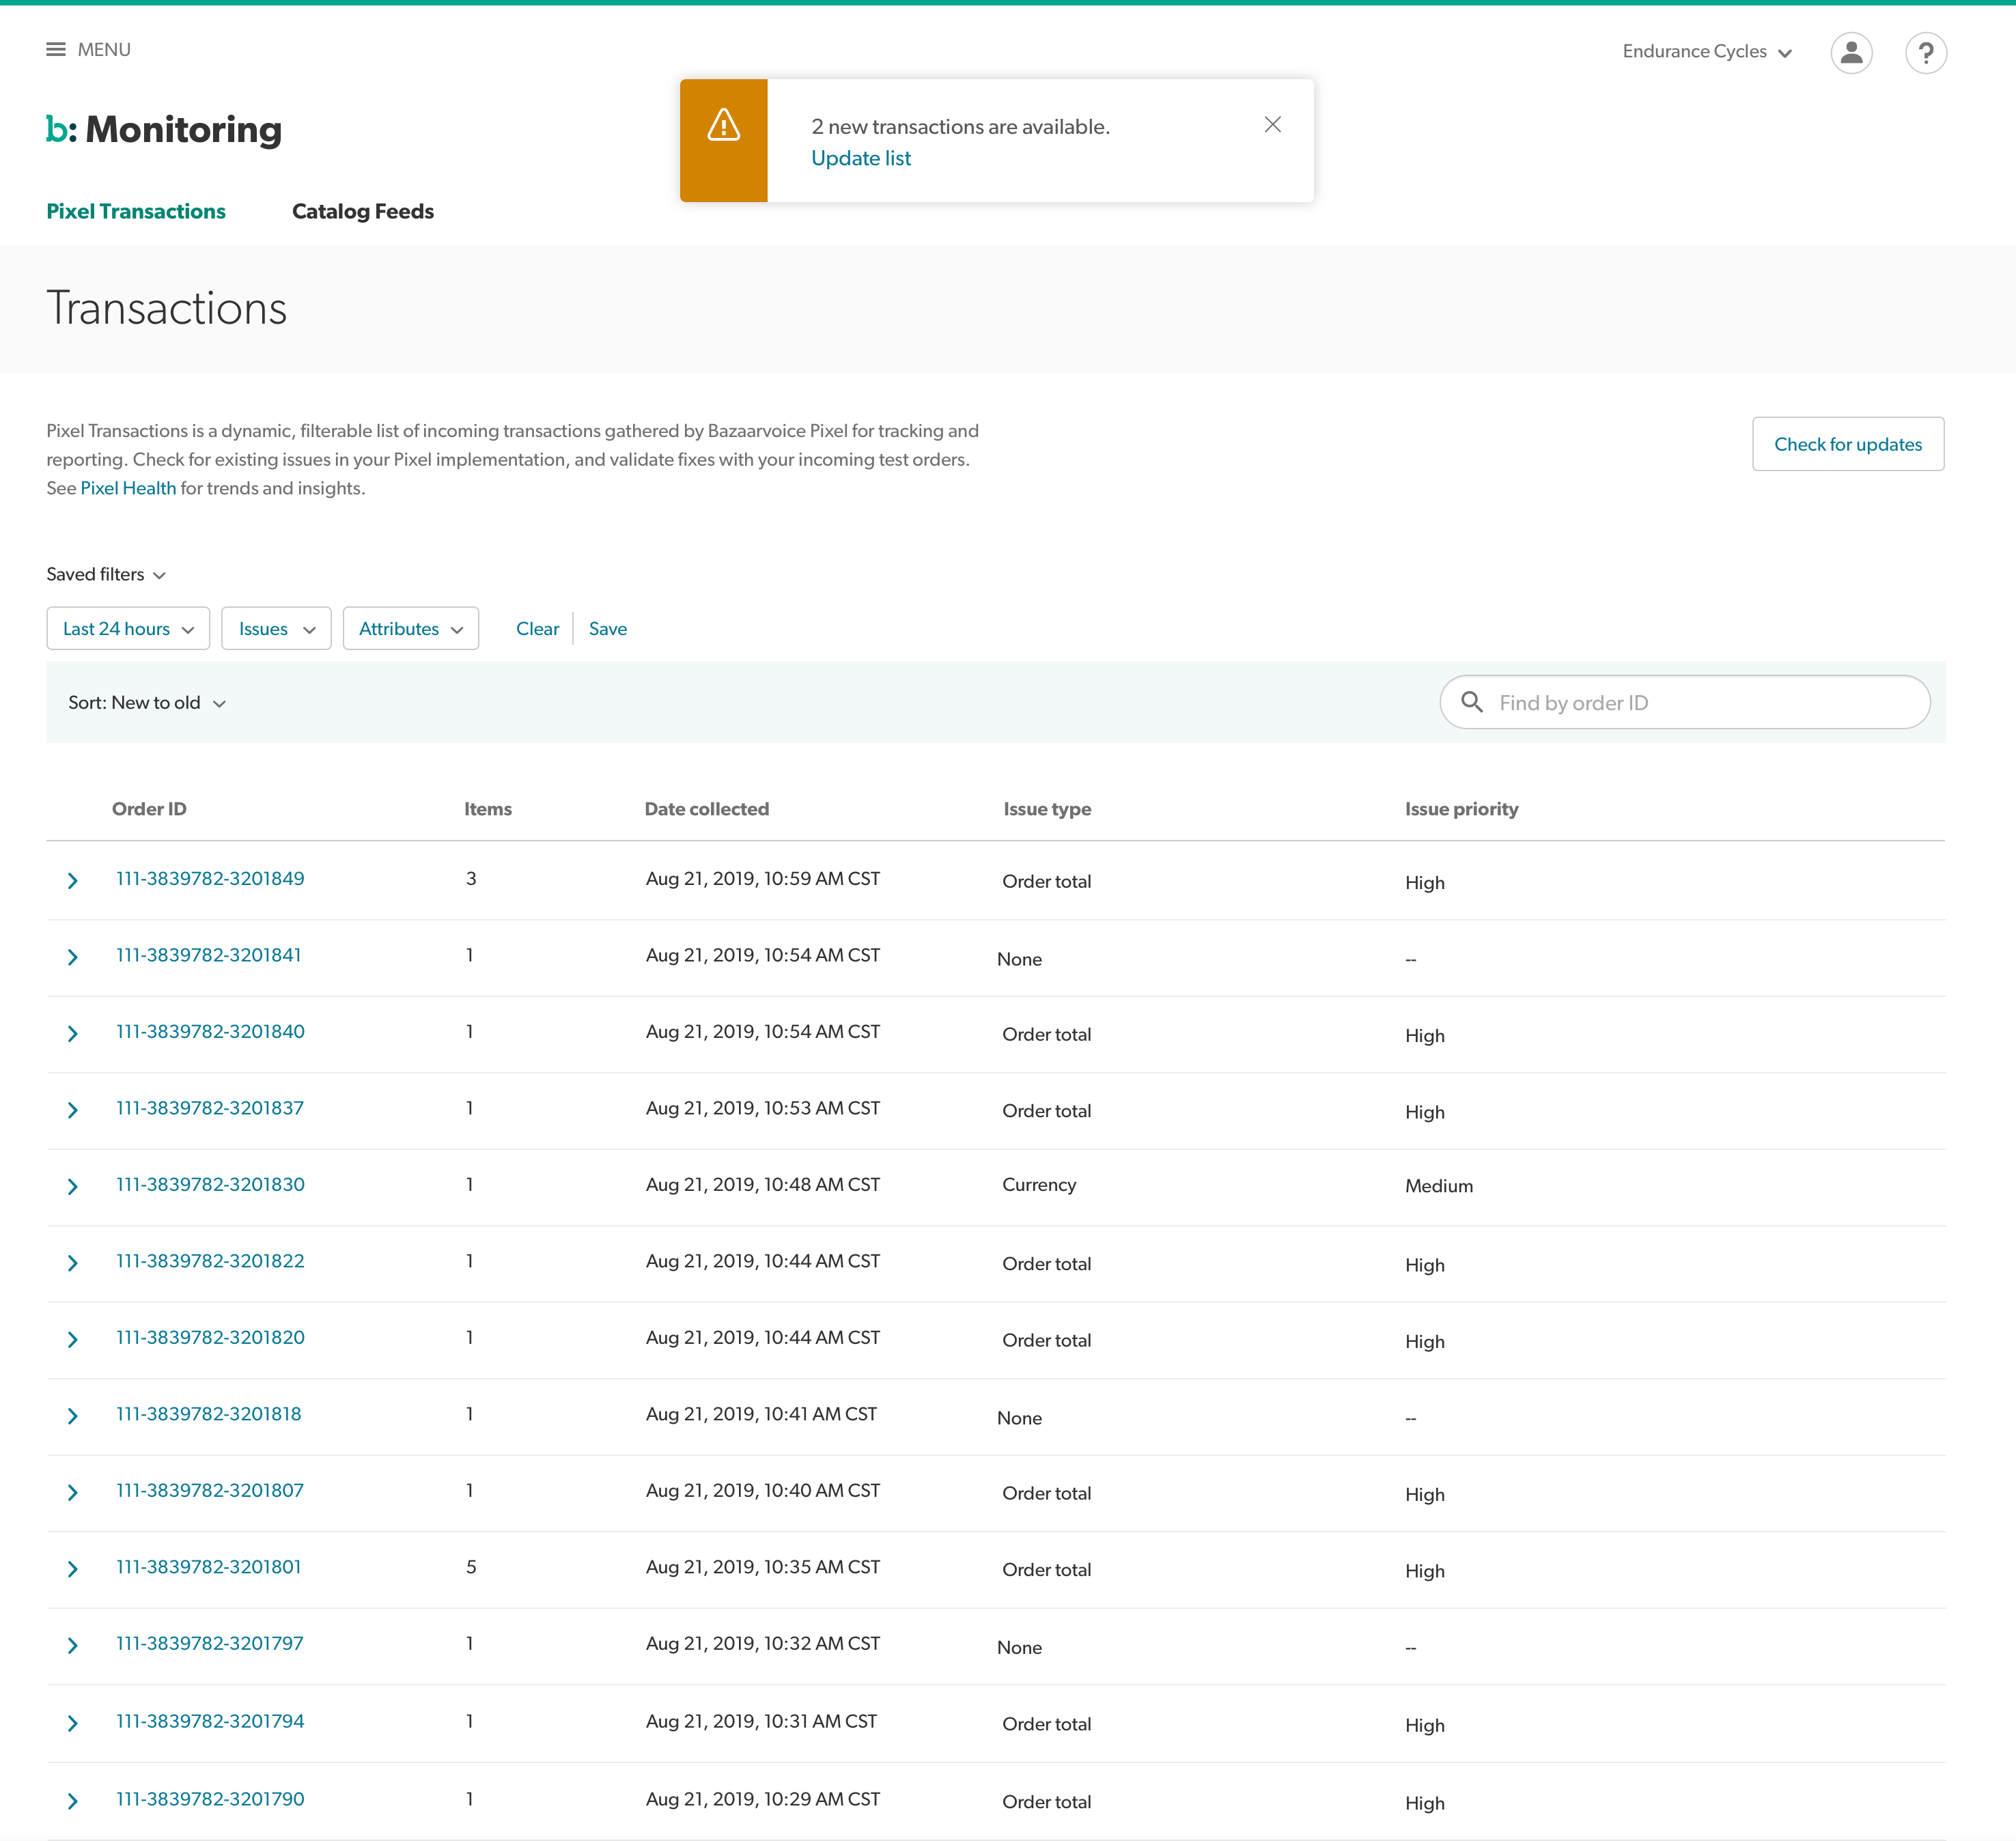
We now knew that our solution had two main tools:
- Alerts to keep the business user apprised of any problems with the Pixel, with access to sharable information on how to fix the problem
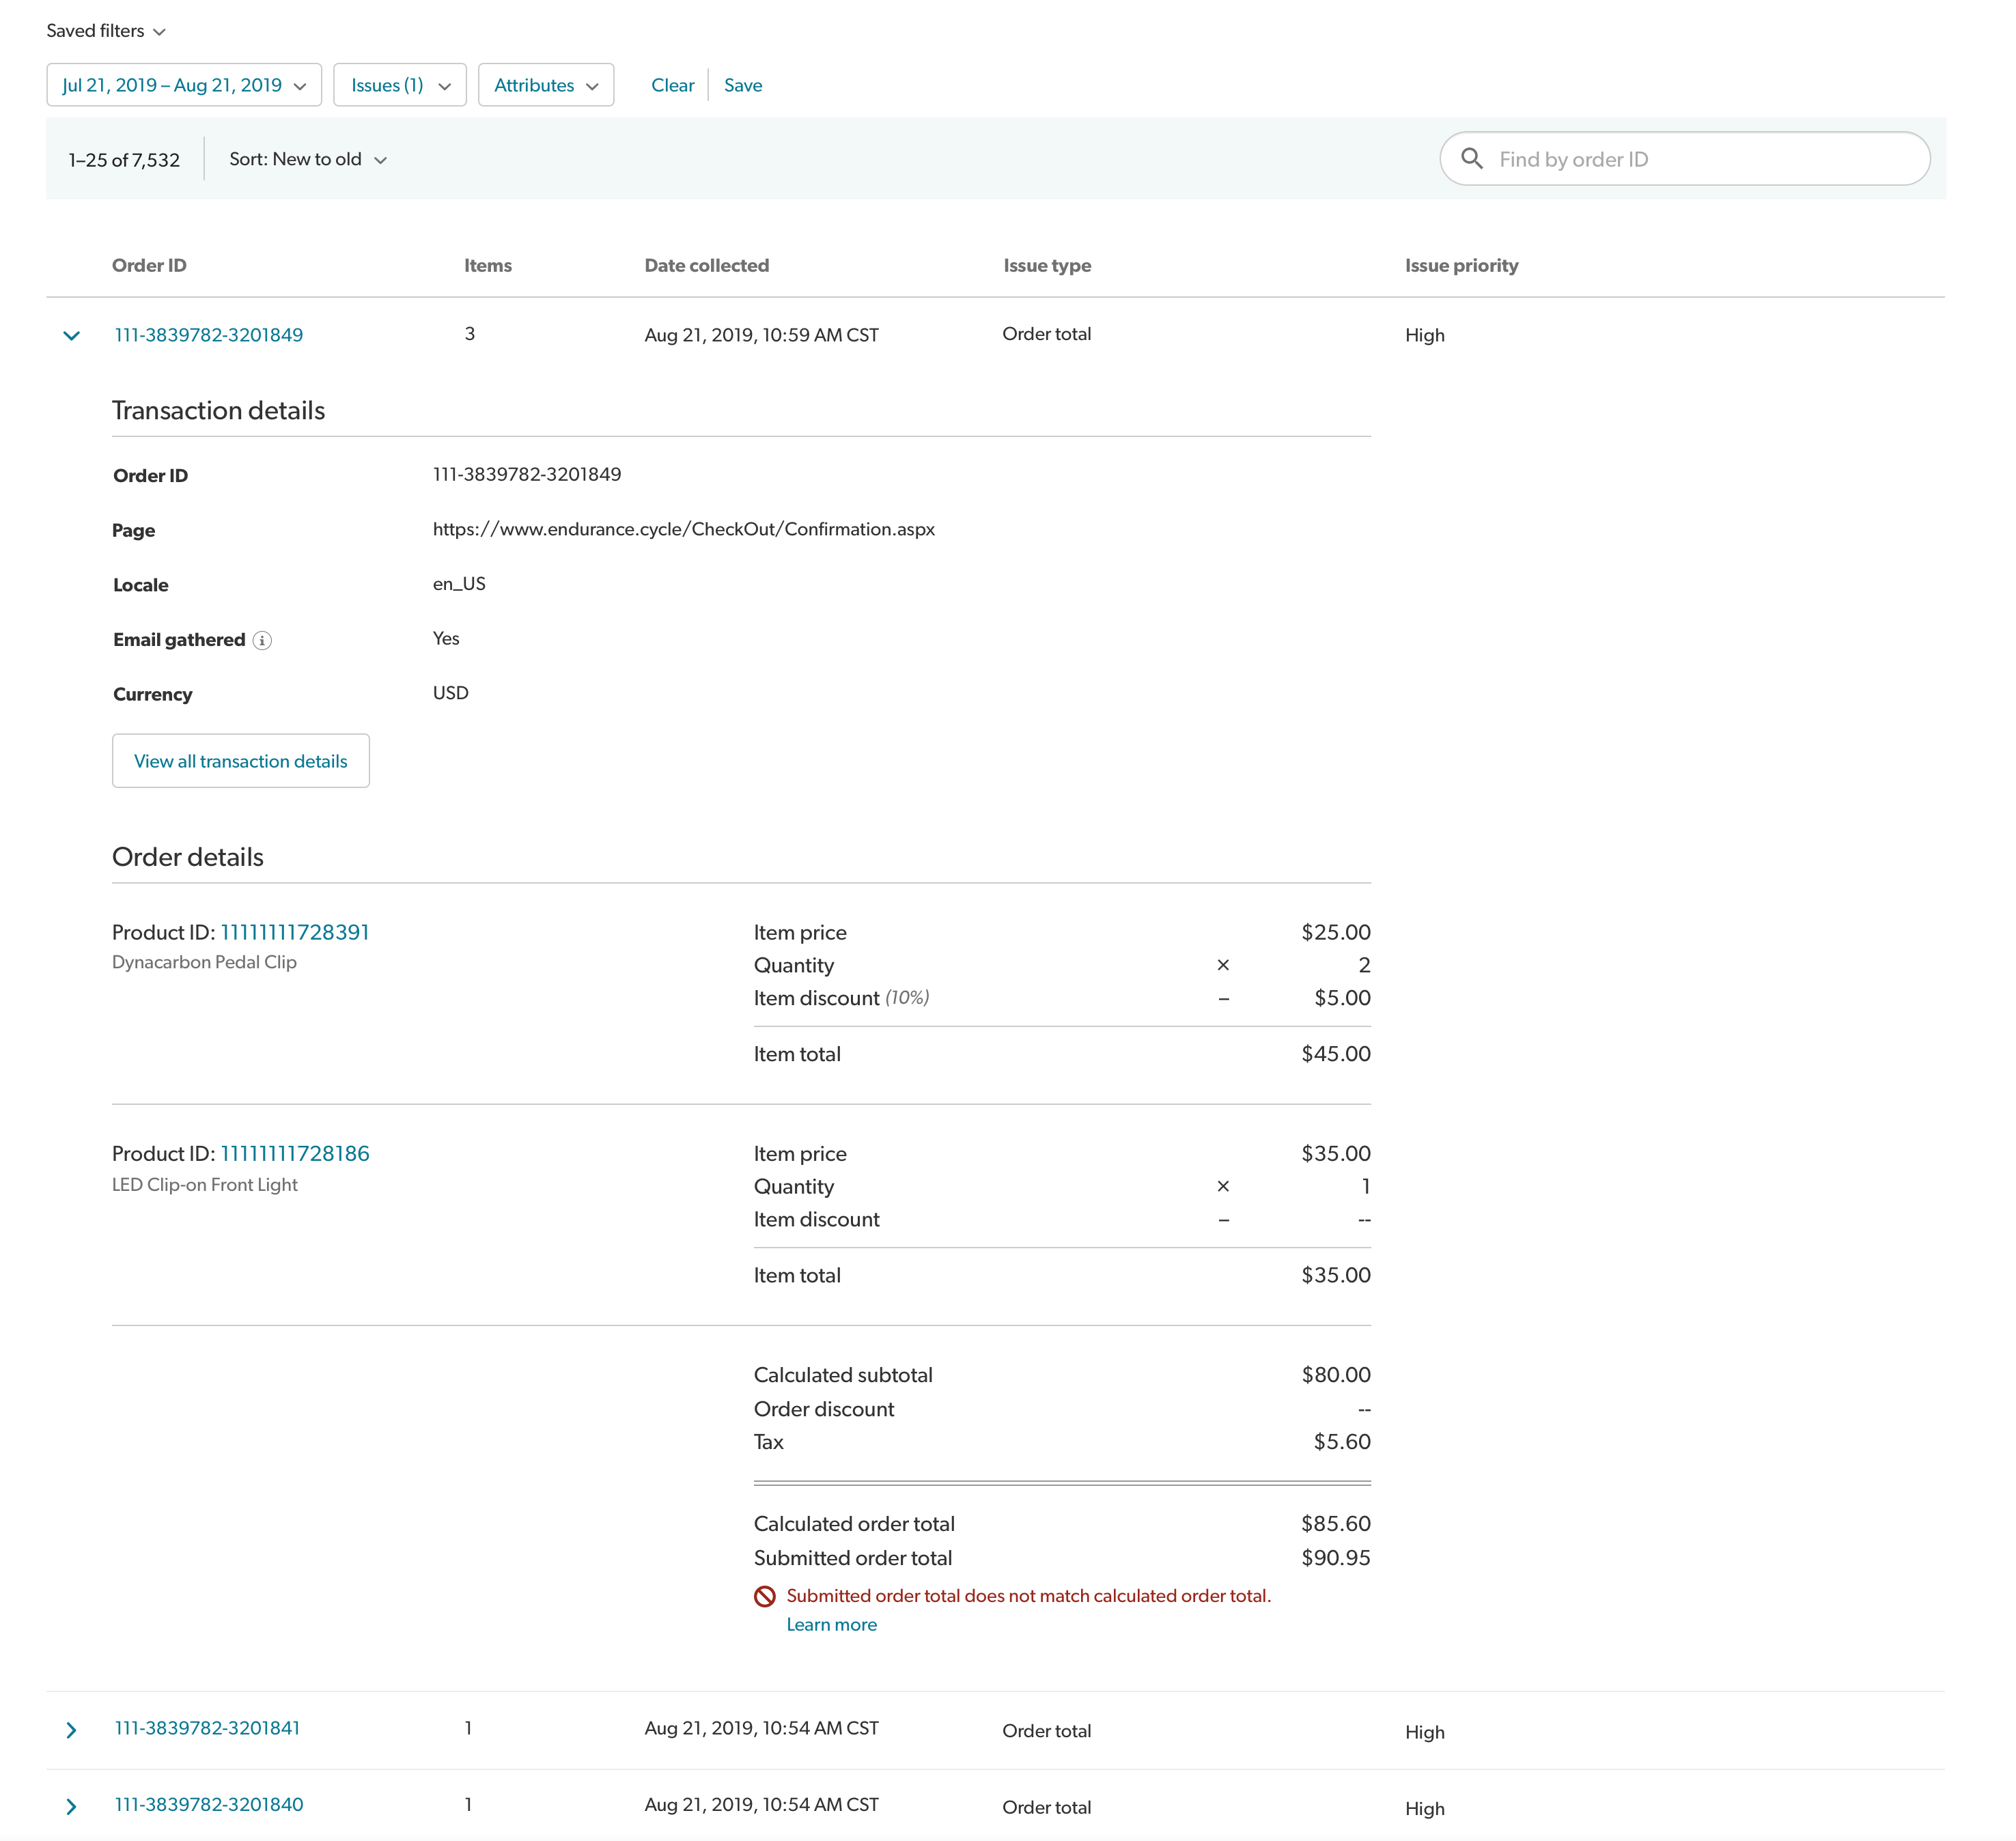
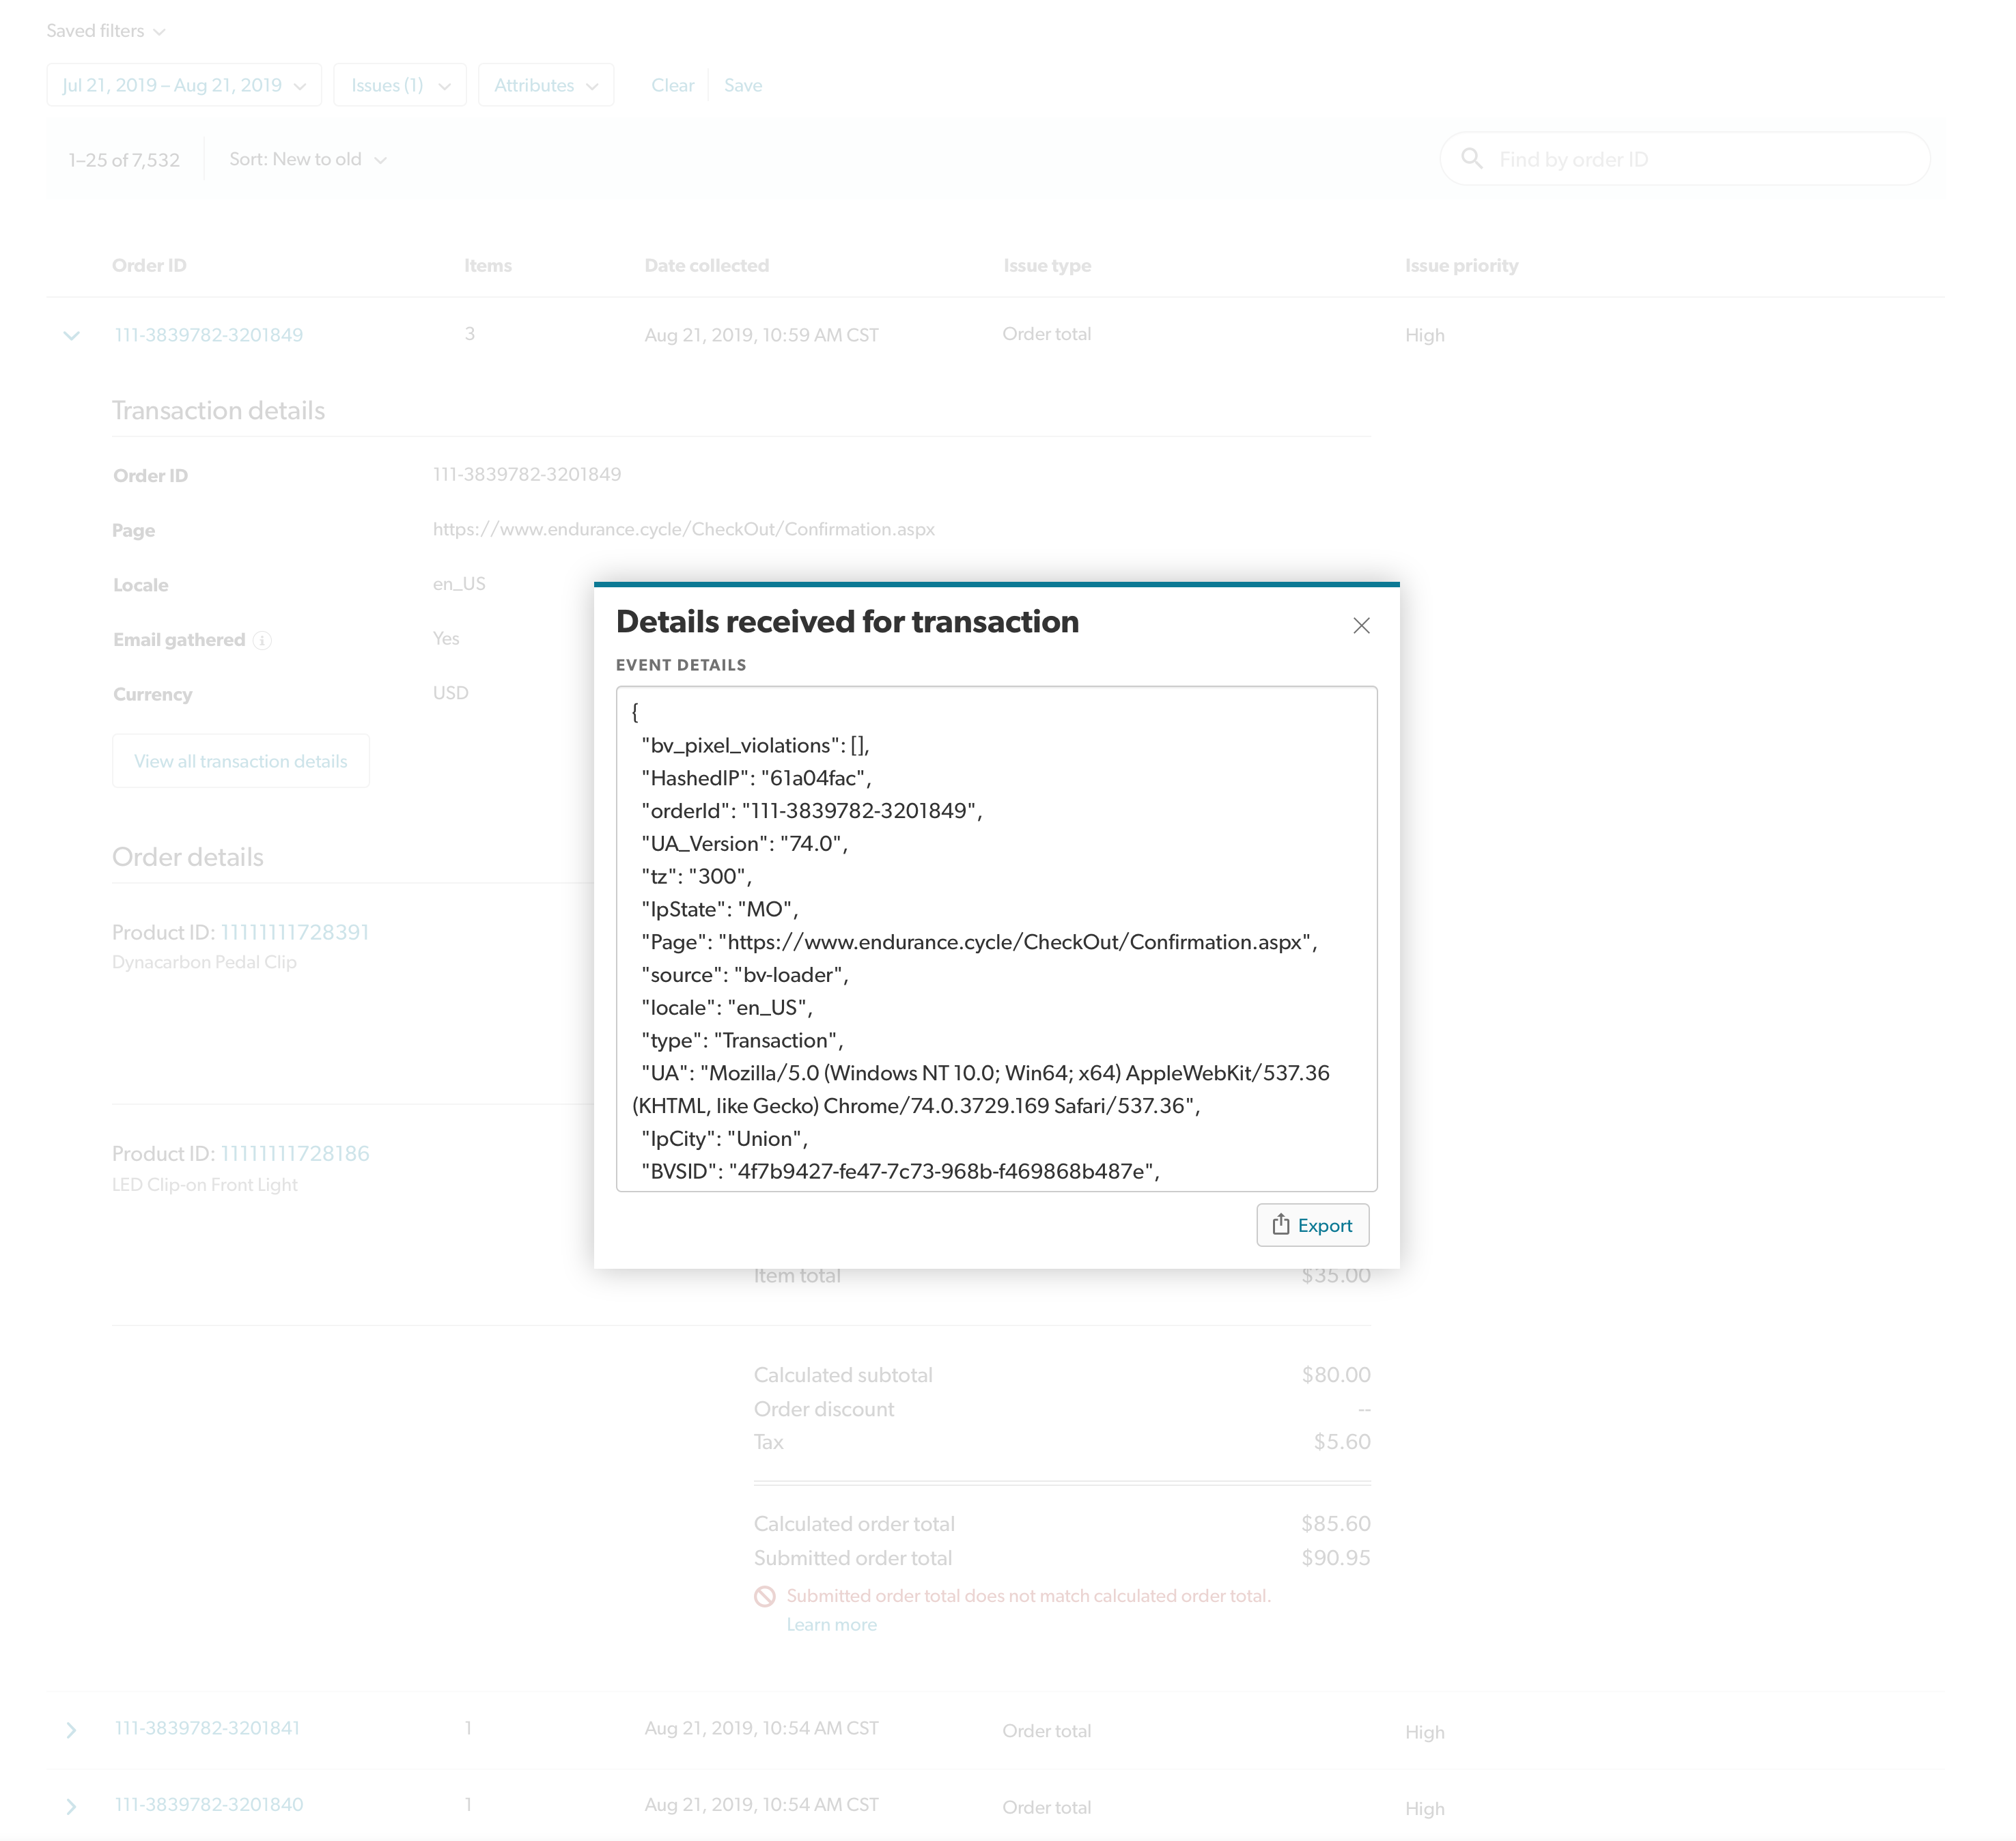
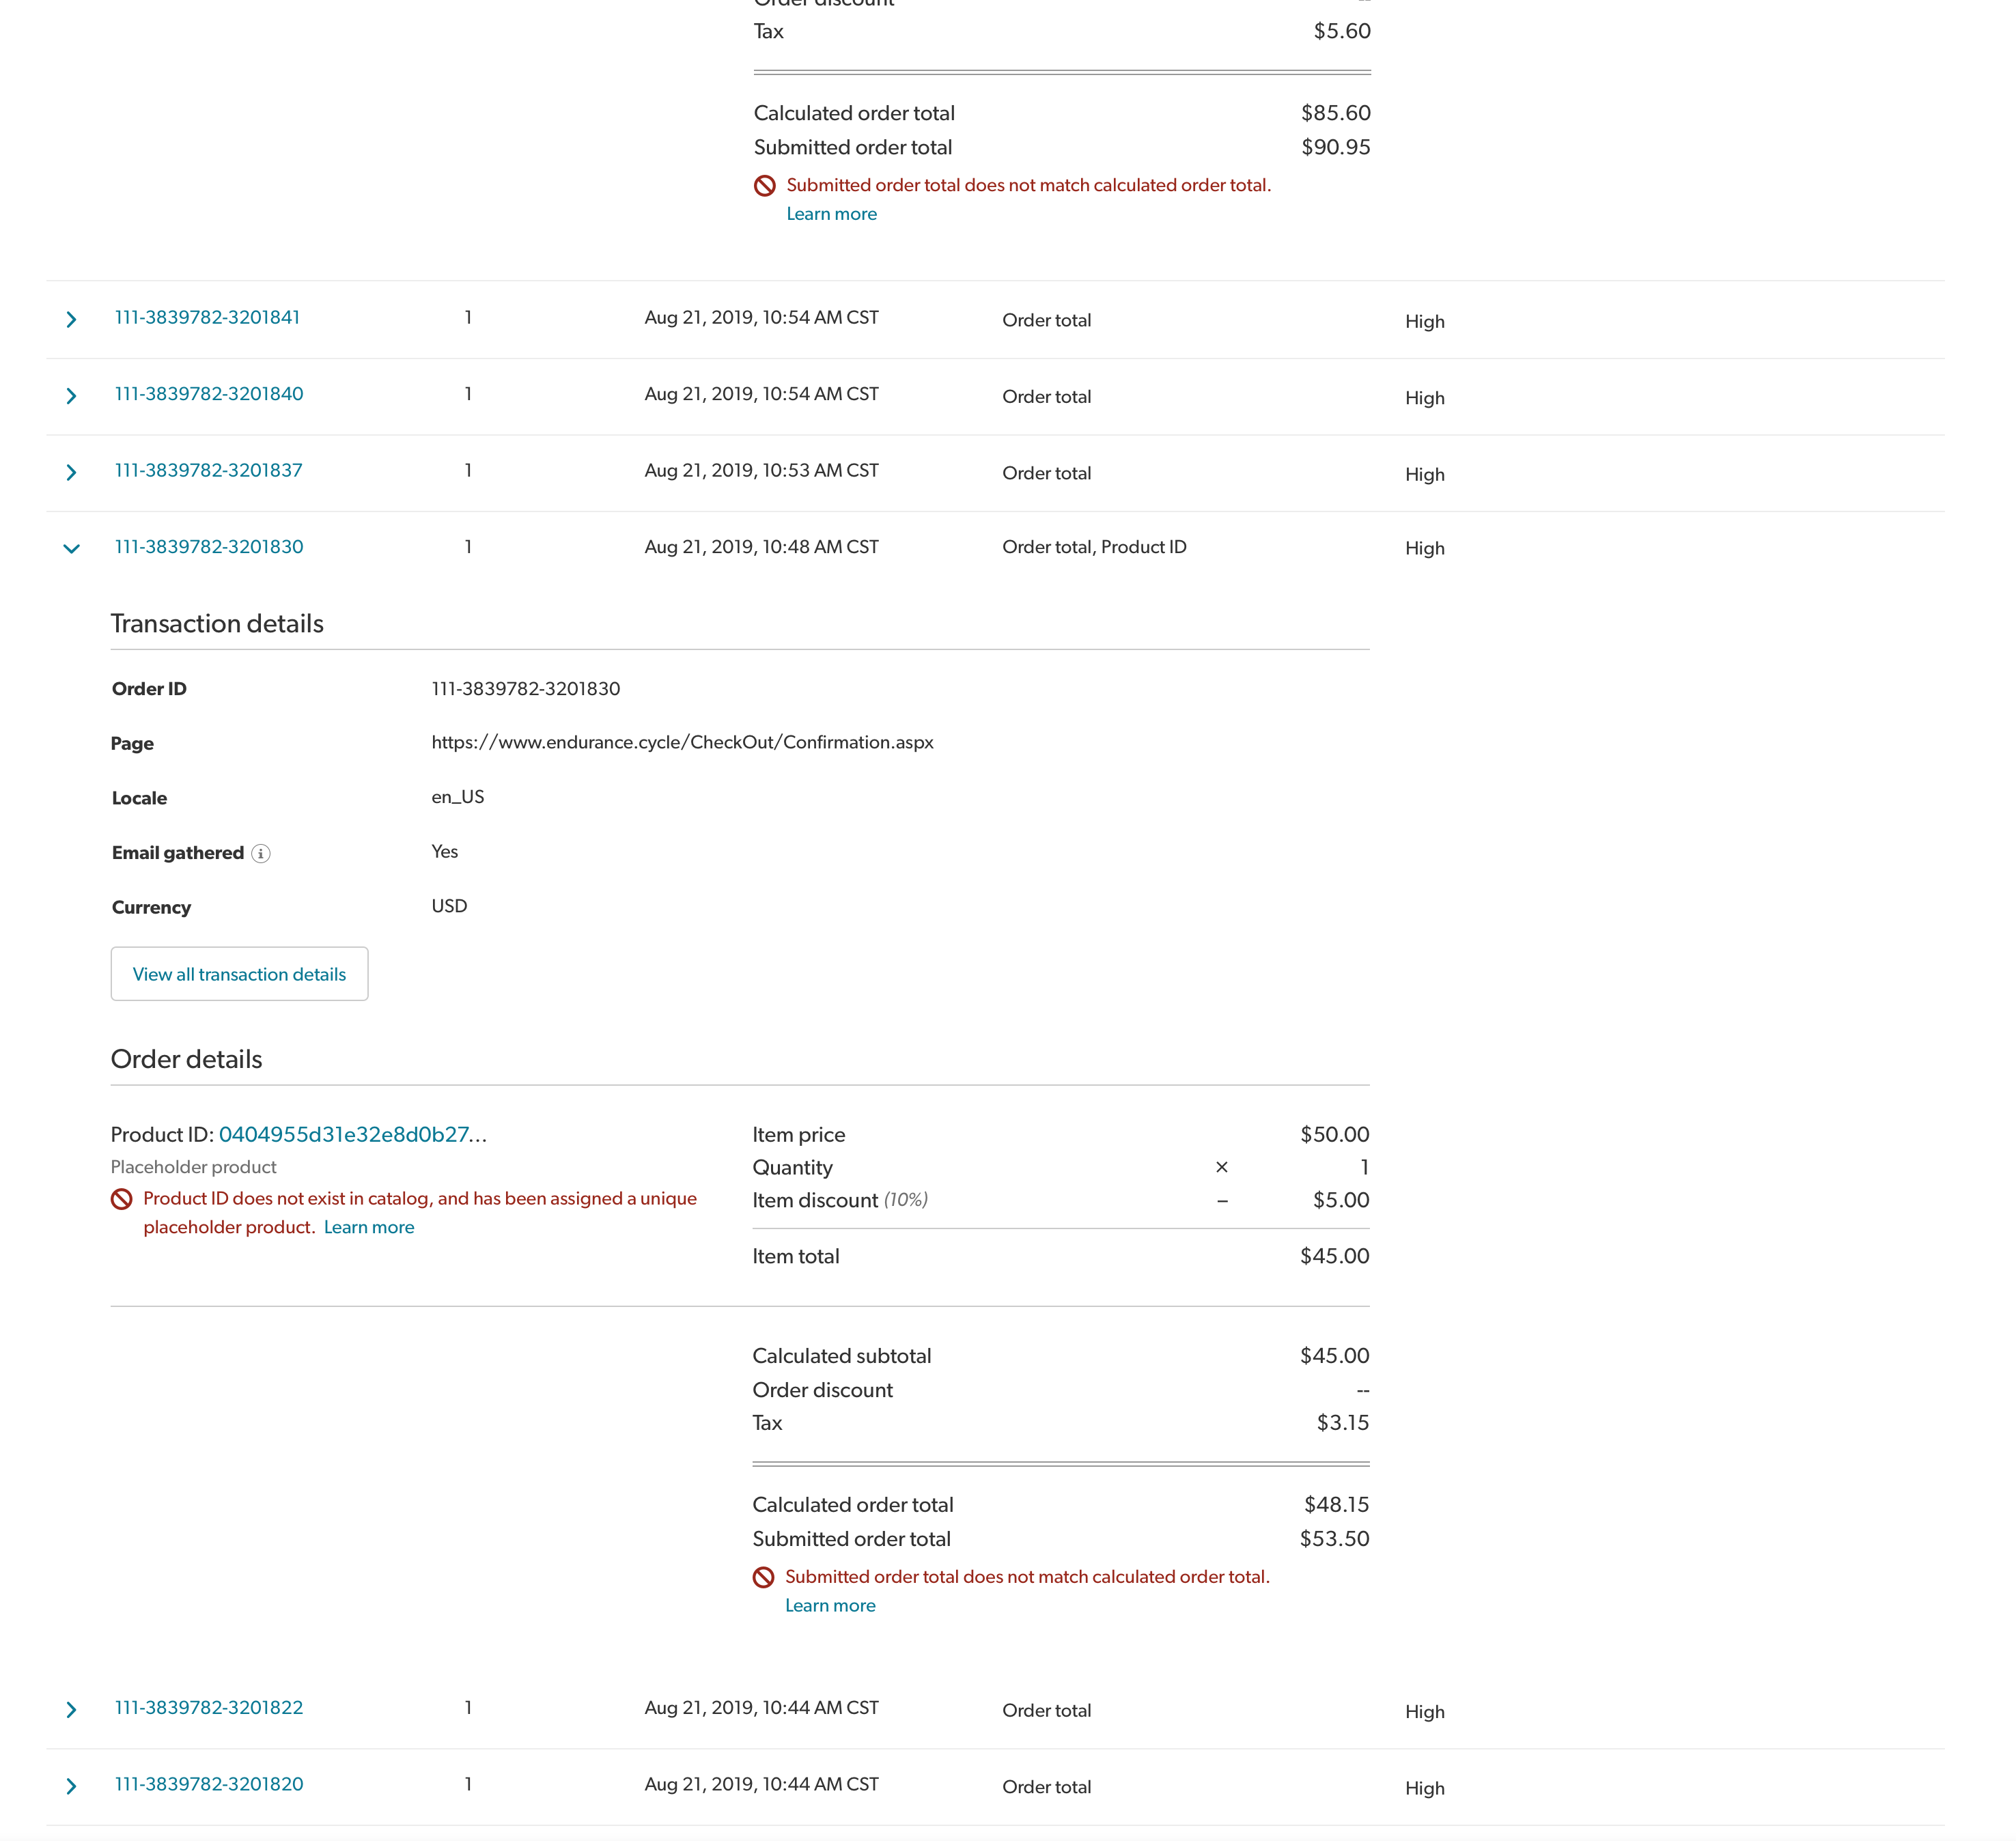
- A way to monitor the incoming transactions the Pixel was recording, with any errors flagged to aid technical troubleshooting
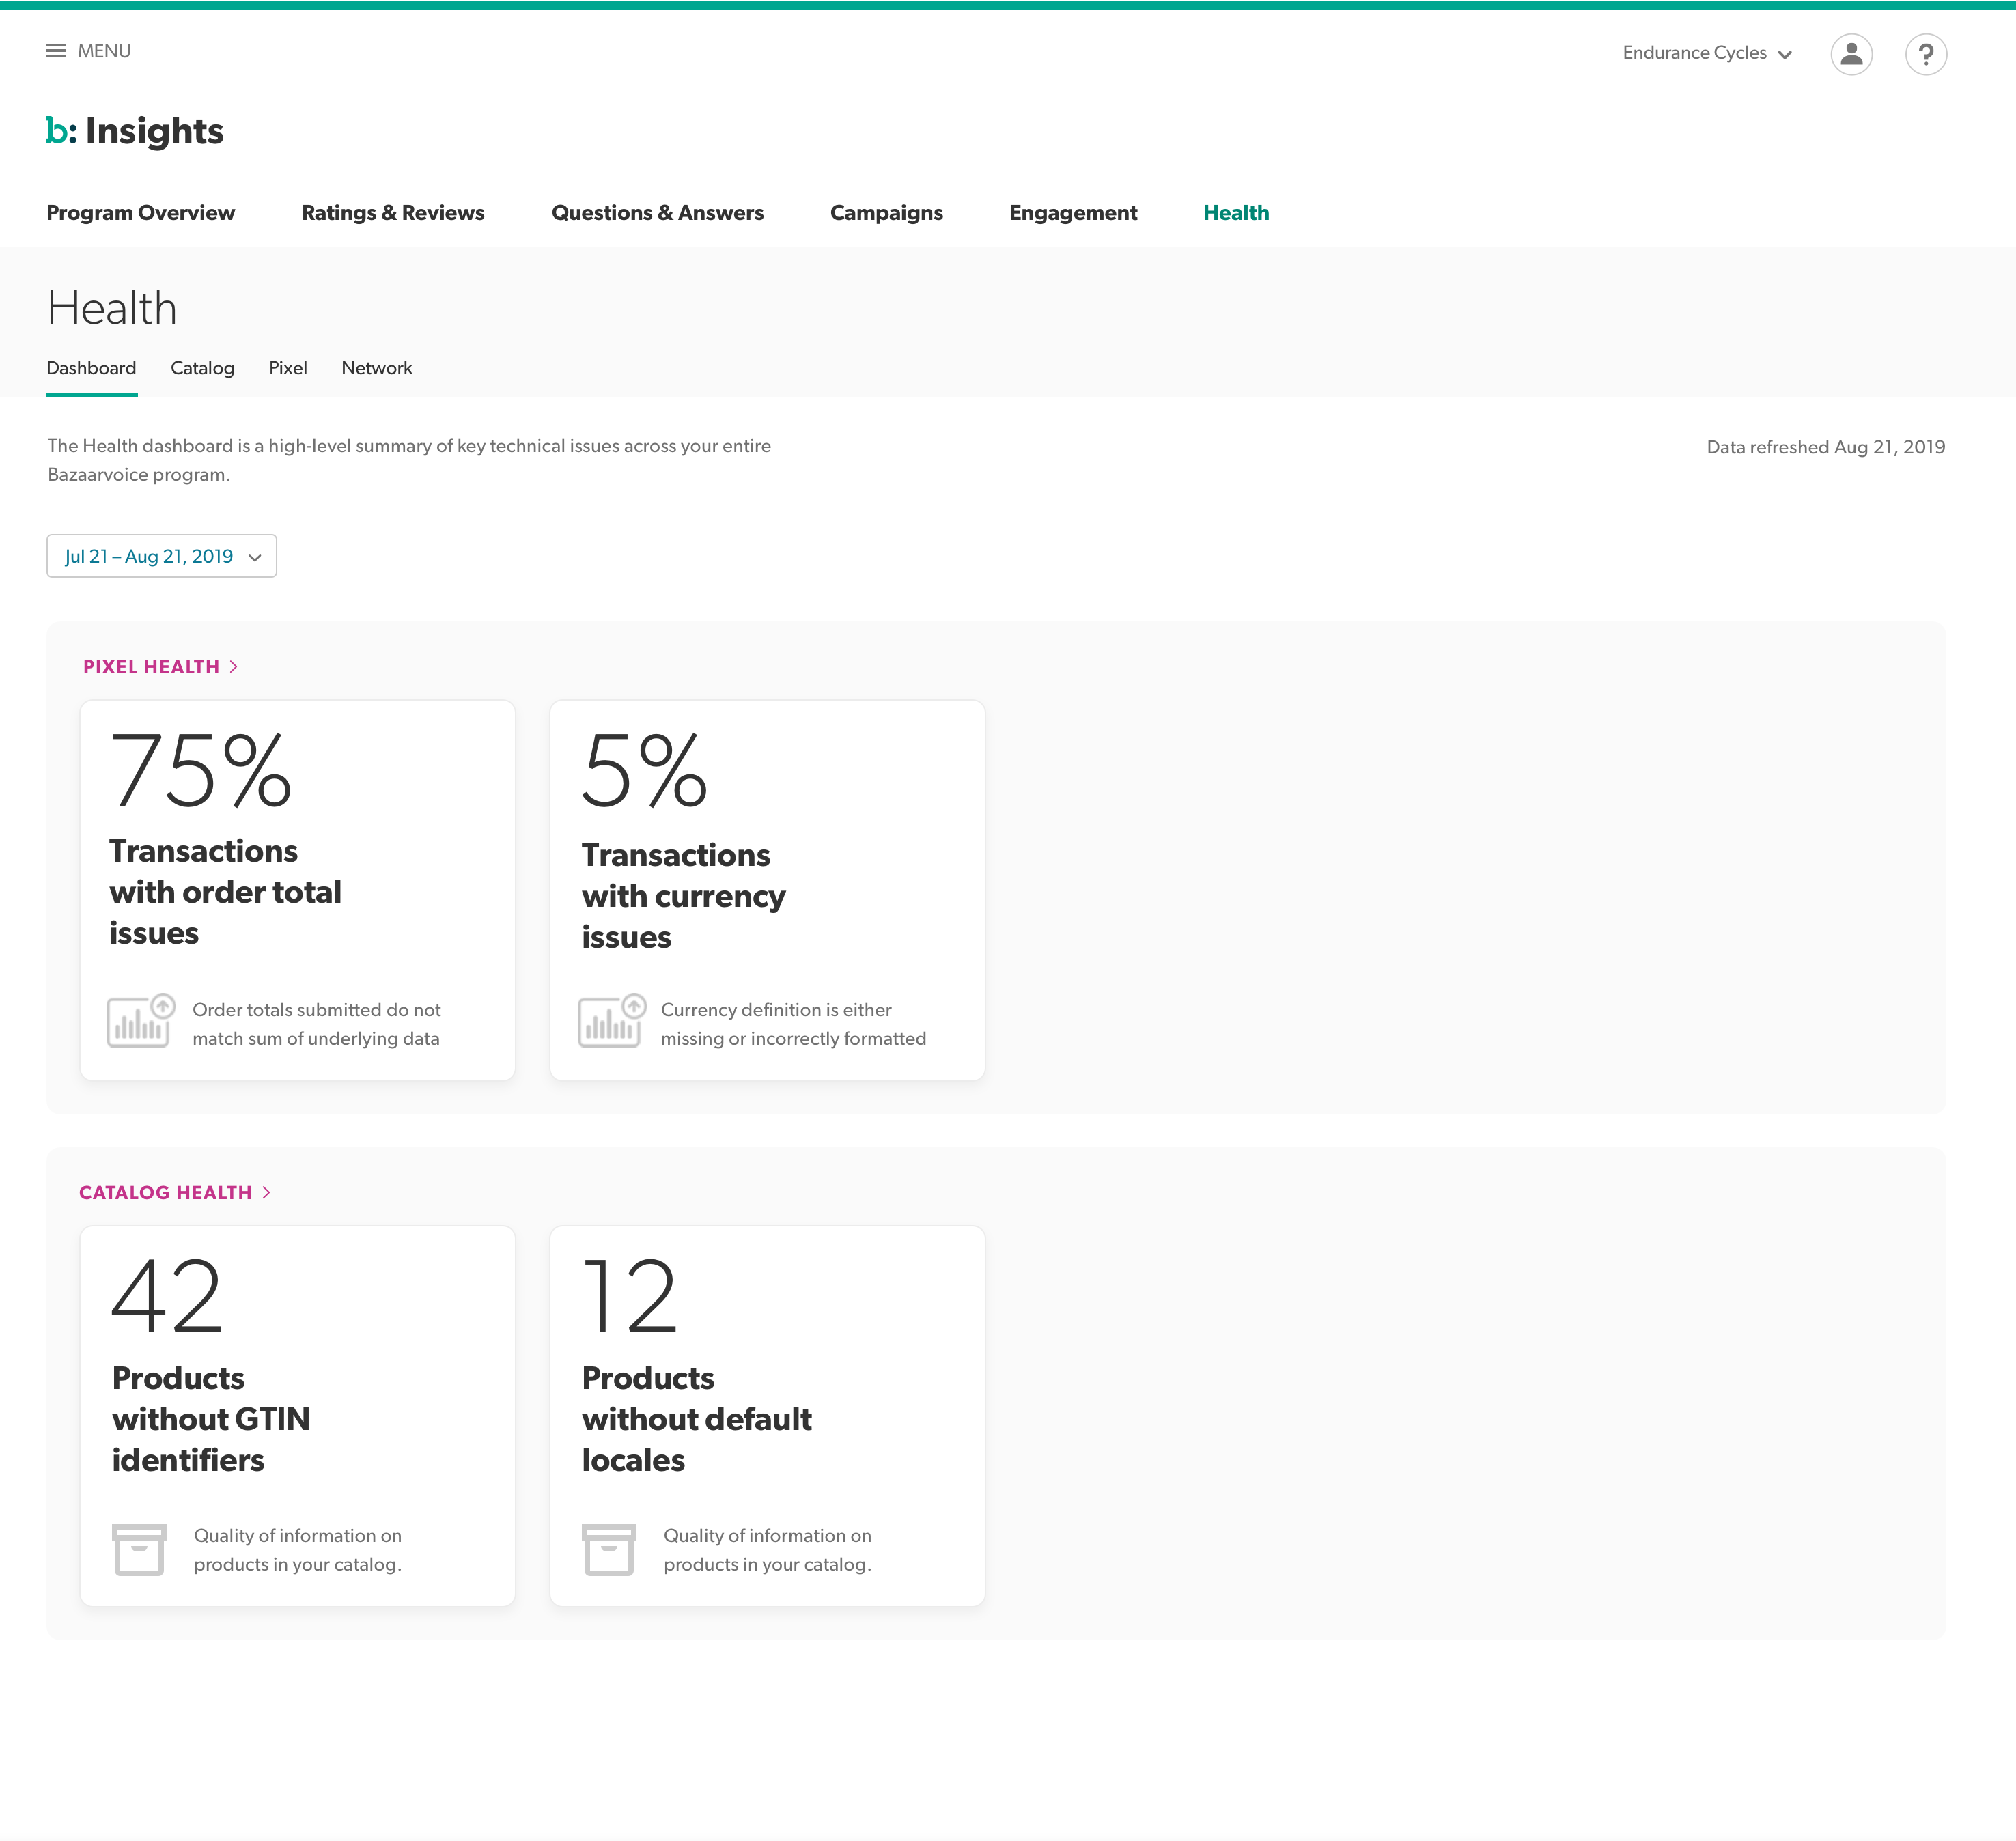
I designed the first rounds of each tool, starting with low-fidelity wireframes and working toward higher-fidelity mockups. We coordinated with other teams in the organization to incorporate our alerts into a new Insights dashboard that would include a section on the client's technical health. We worked with the design system team to ensure our proposed solution aligned with existing patterns and styles. I brought in our technical writer earlier than was normally done at Bazaarvoice, to aid in understanding of the whole product and ensure we had the right language behind what would be a very documentation-focused solution.
I built a prototype in Invision to cover a workflow of discovering an issue in the Insights dashboard, learning more about how it might be fixed, and viewing data in the transaction monitoring tool to ensure they understood the technical problem. I also included a view options in later prototypes to gauge reaction to different solutions problems we had identified.
The first round of user sessions with the prototype were done with the internal customers, the TAMs and TCs. While they liked the main concepts and what we were trying to solve, they helped identify points of confusion with language and usage of internal terms that clients might not understand. They also said they understood the data included in the transaction monitoring tool, but that the layout did not make it immediately obvious.
Armed with this feedback, I reworked the layout and worked with our technical writer on editing our copy into something with clarity and devoid of internal jargon. We took the updated prototype to user sessions with a series of clients, first with business users and then (as able) directly with engineers from clients. We discovered that many enterprise clients were less likely to have their engineers engage with our tool. They needed to be able to pass along high-level concepts, links to full step-by-step documentation, and example data dumps, in JIRA tickets or support requests with engineering teams and third-party development contractors.
Early wireframe showing example dashaboard cards and where each card's action might lead the user.
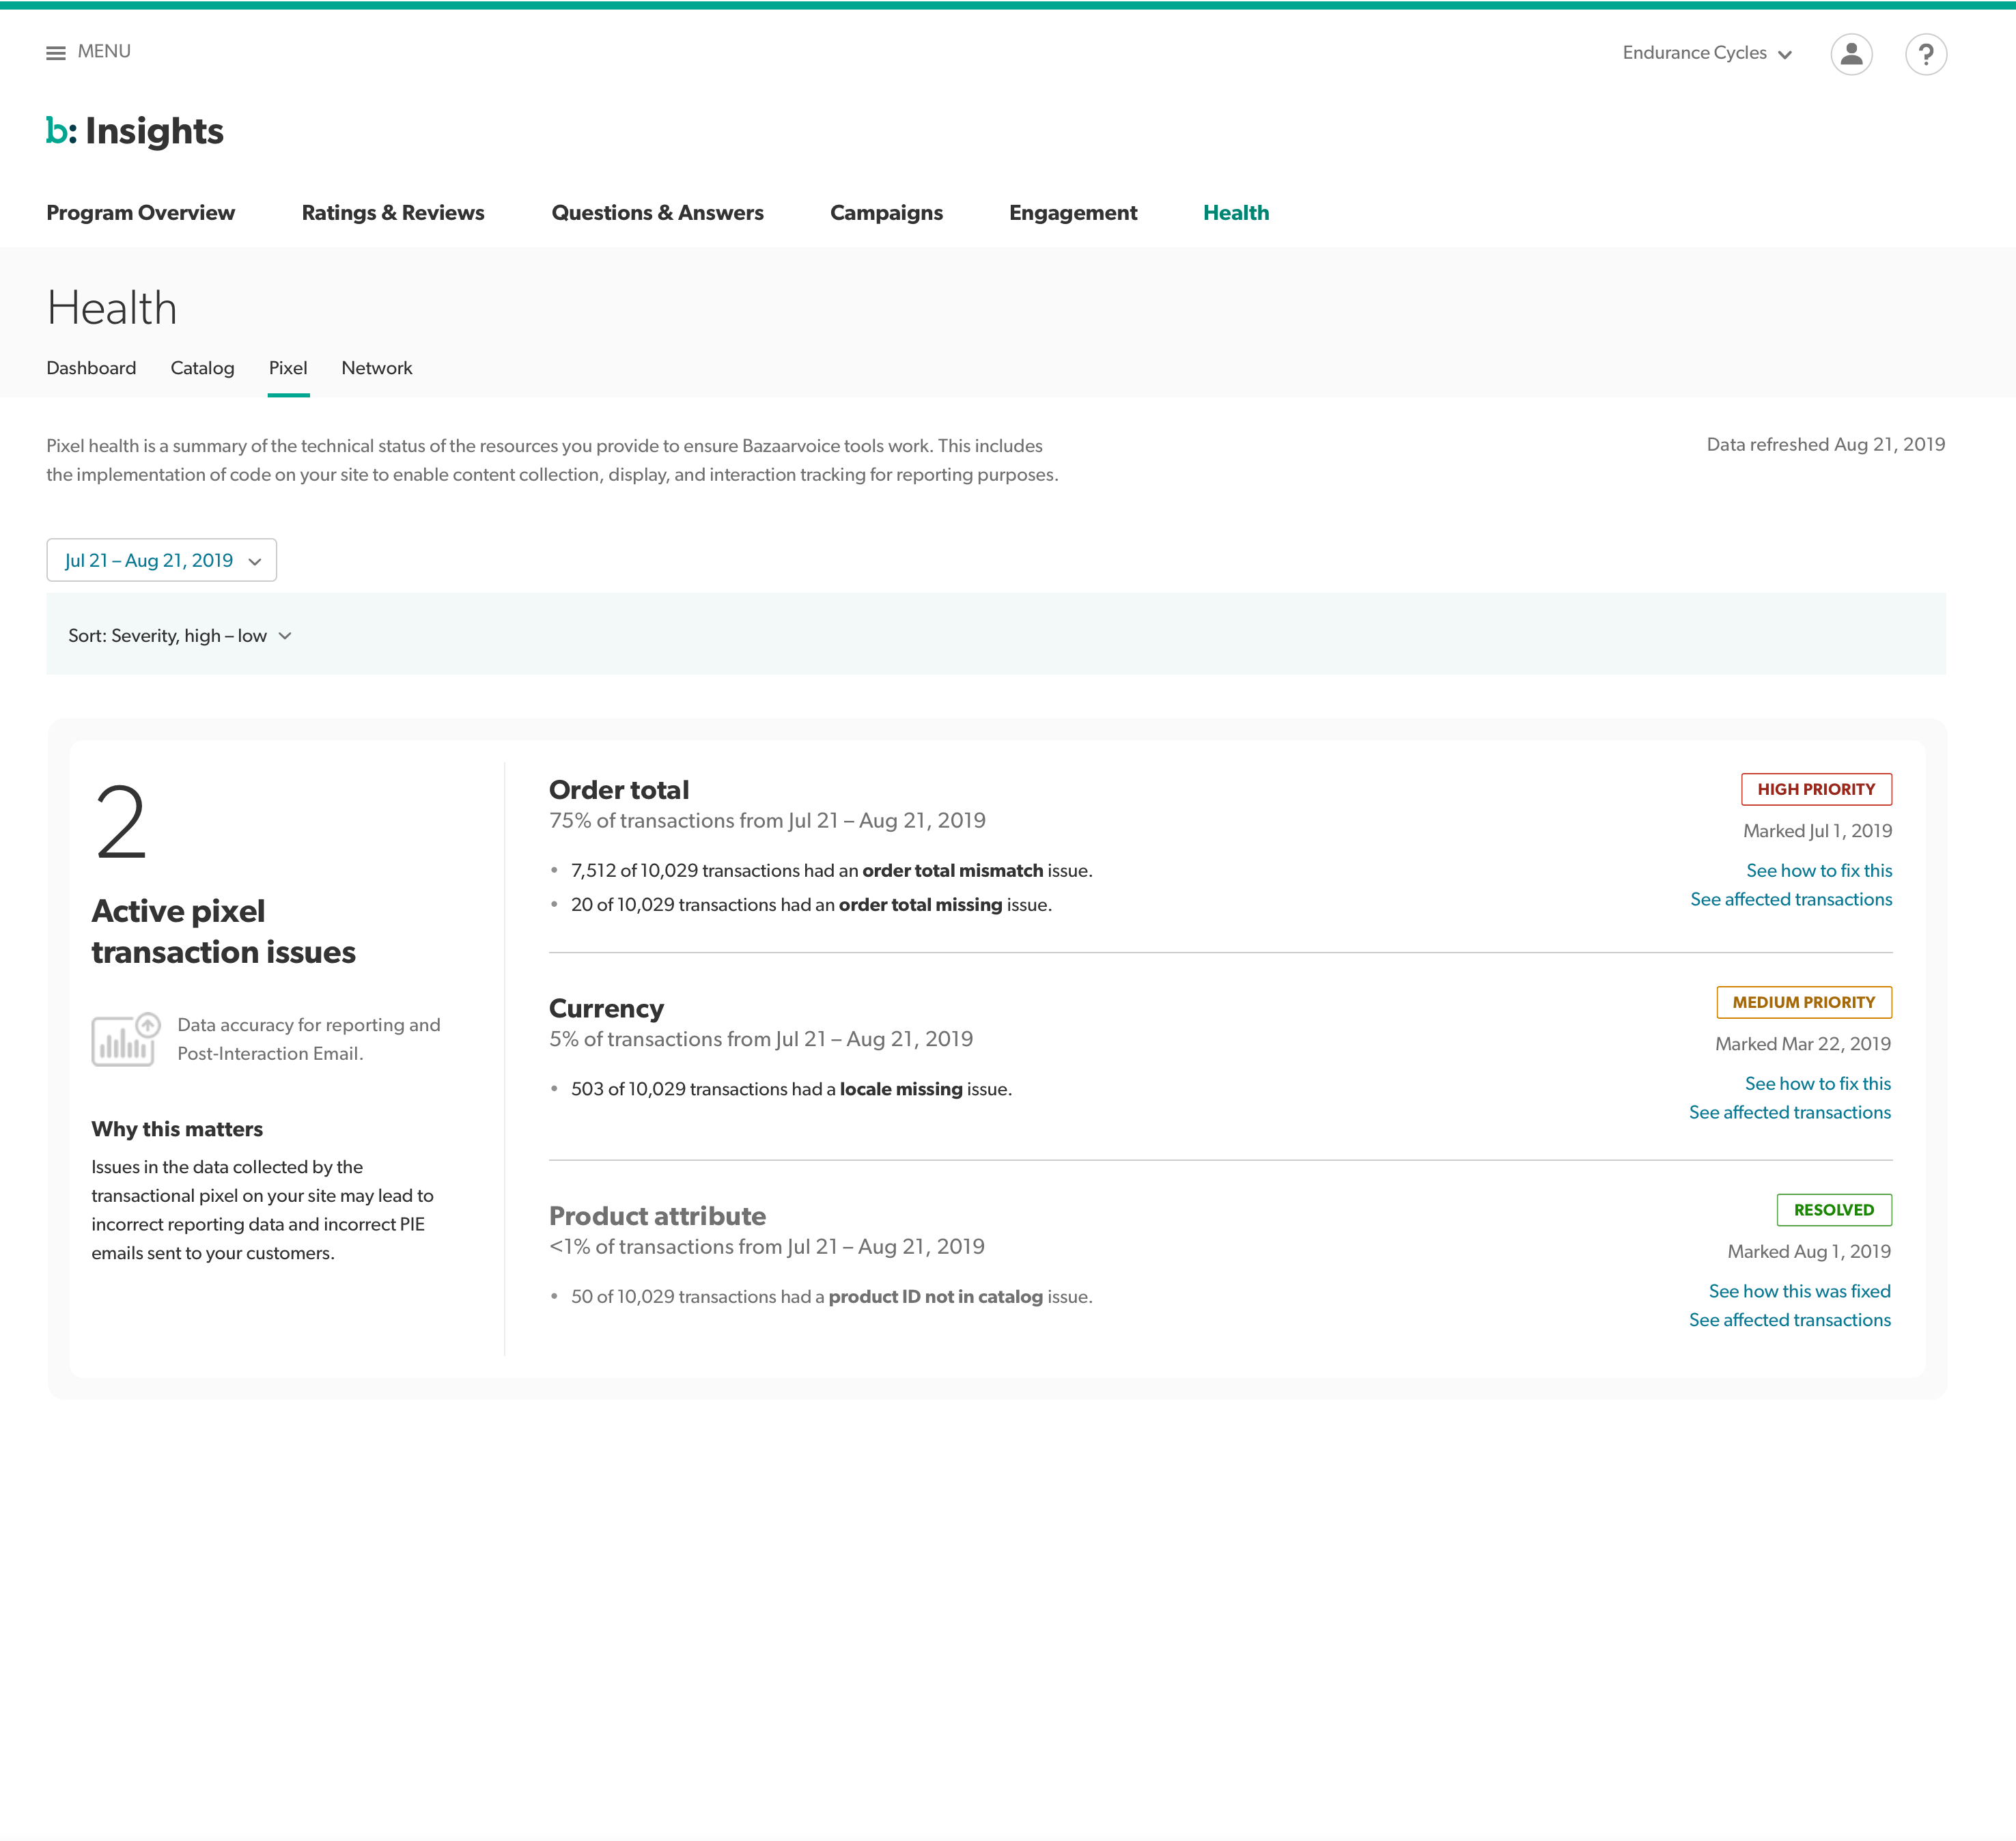
Early wireframe of a transaction's details, and surfacing inline error messaging to aid troubleshooting.
Delivery
With the final study findings compiled with the support of our user researchers, I updated the final prototype in Invision and delivered design specifications to our engineering team. We reviewed the spec, and made small changes based on some technical concerns, and the team delivered an MVP to pilot customers a few months later.
Examples
Other Projects
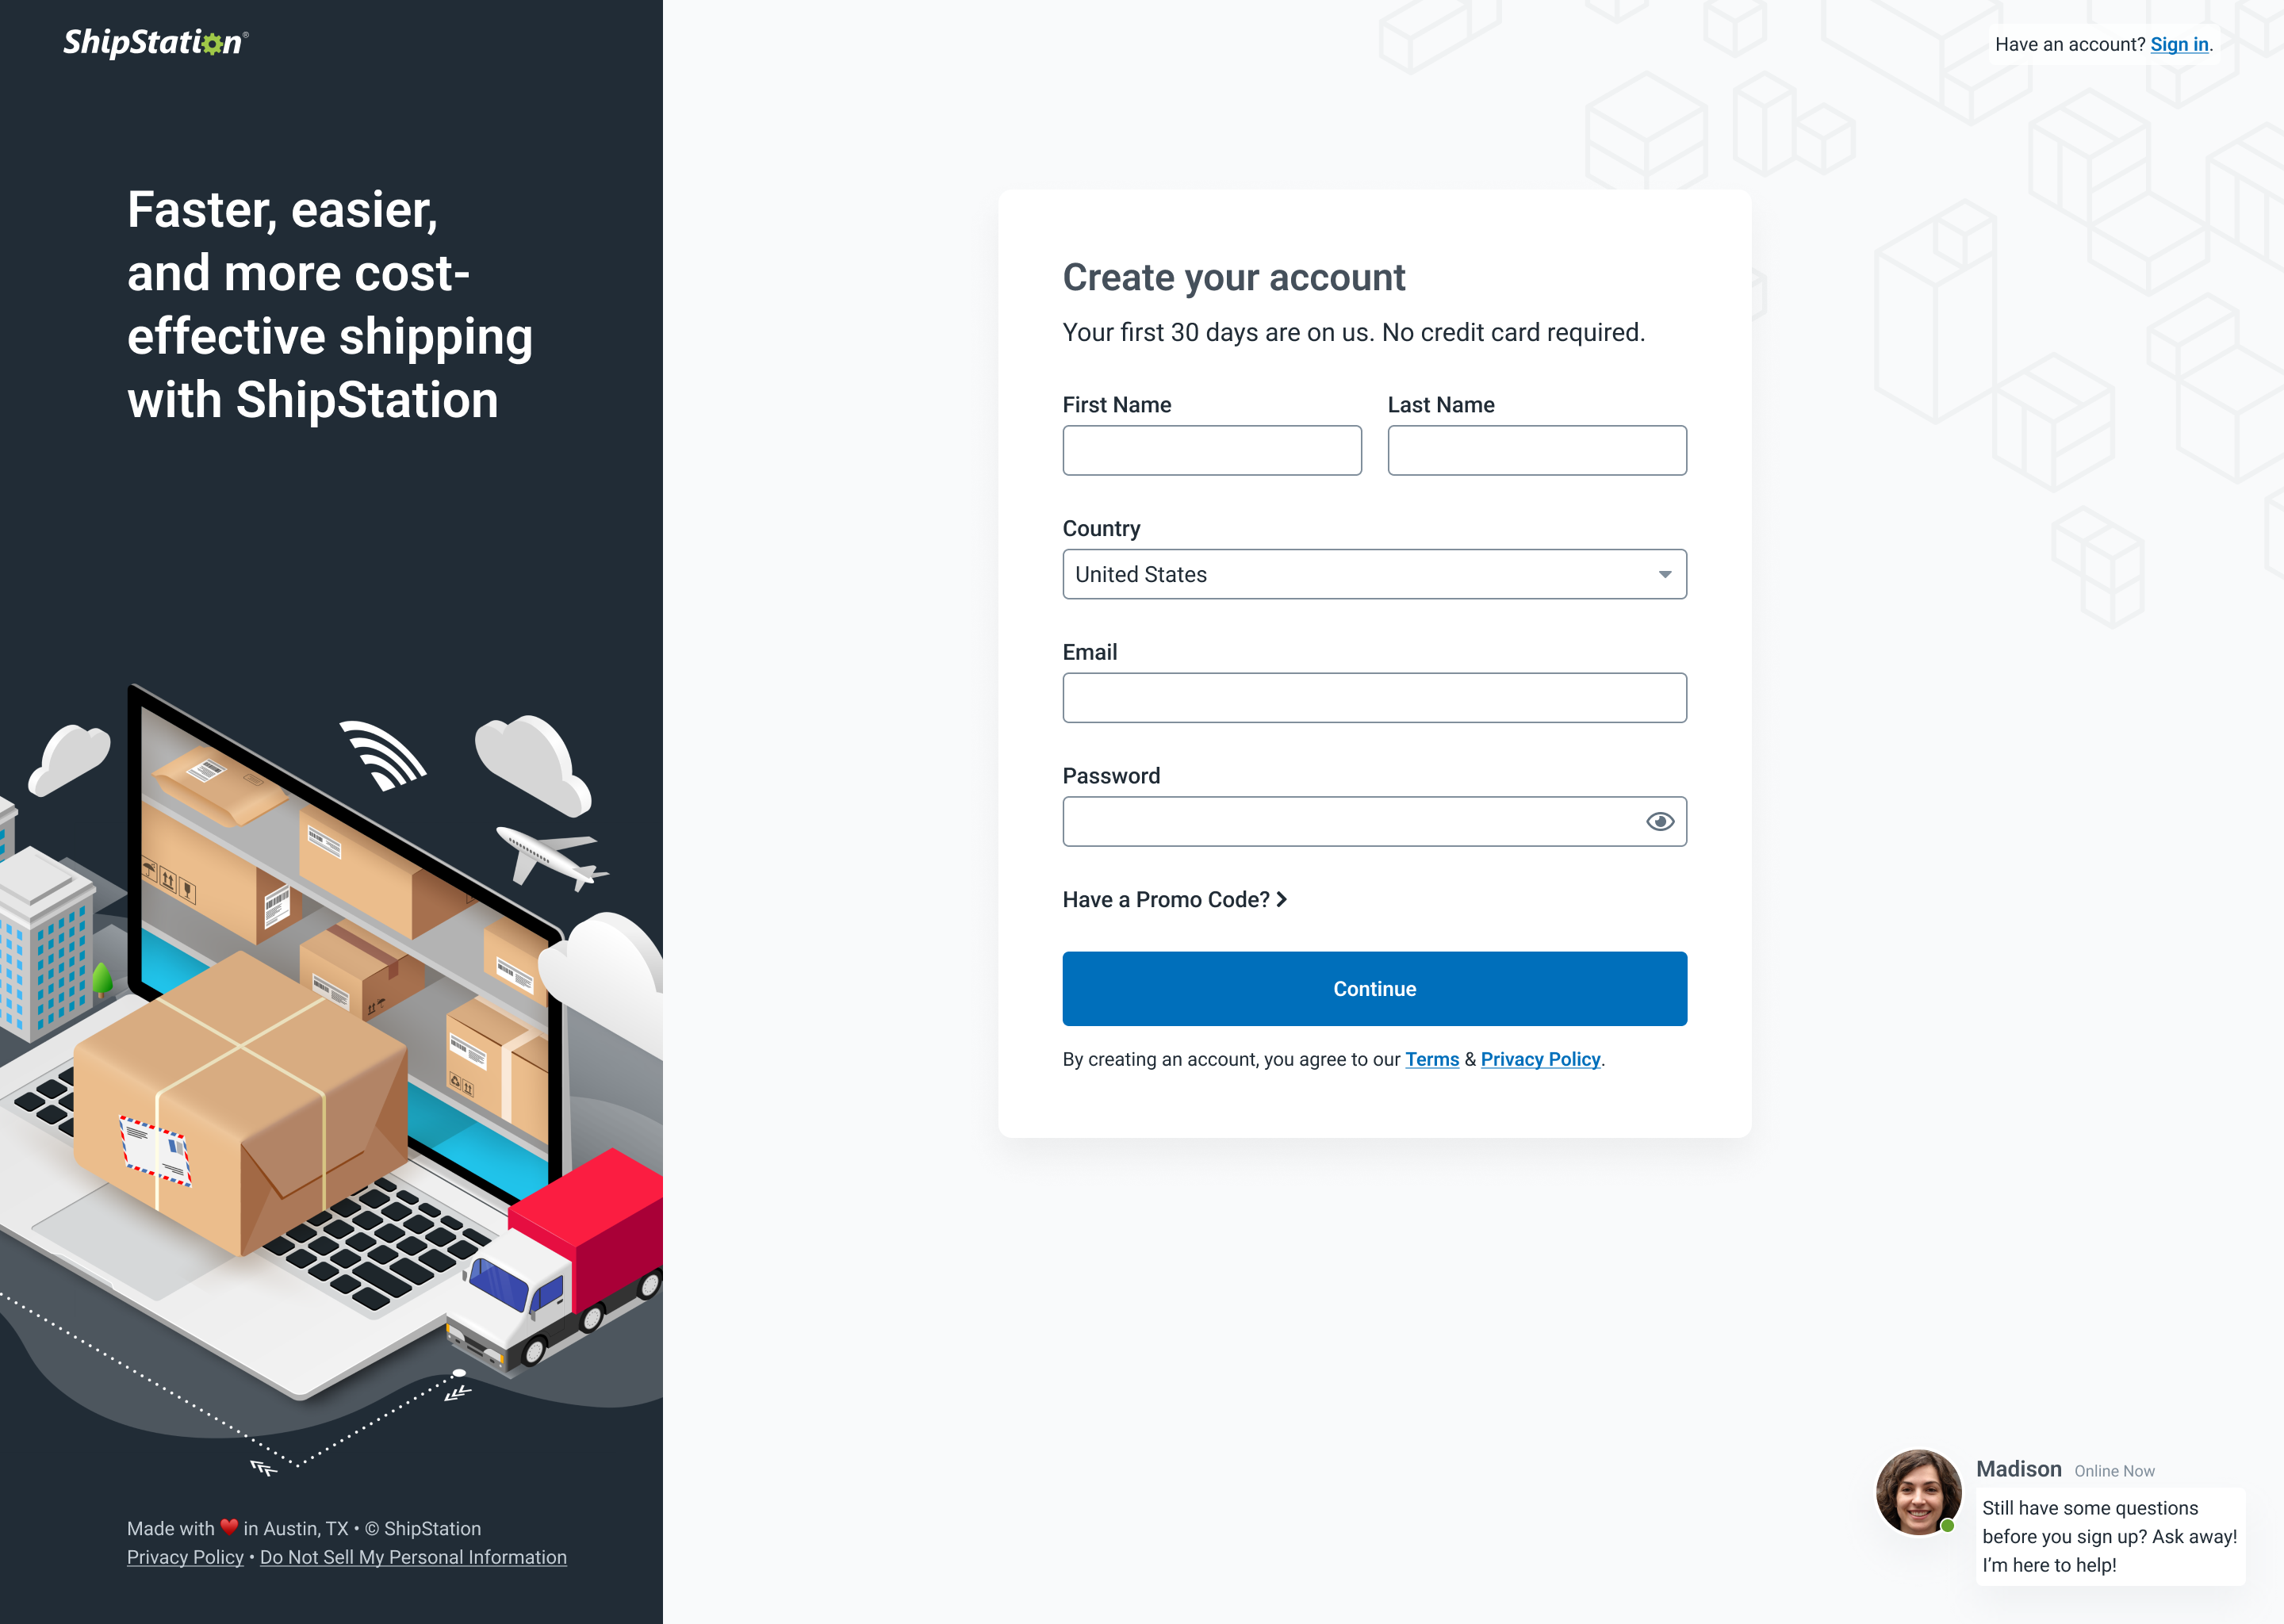
ShipStation OnboardingGrowth & Team Leadership
ShipStation InsightsData Visualization
Auctane Design LanguageDesign System

Amazon Restaurants order managementUX workflow and research for tablet PoS app
Product Catalog ManagementInnovation and user efficiency